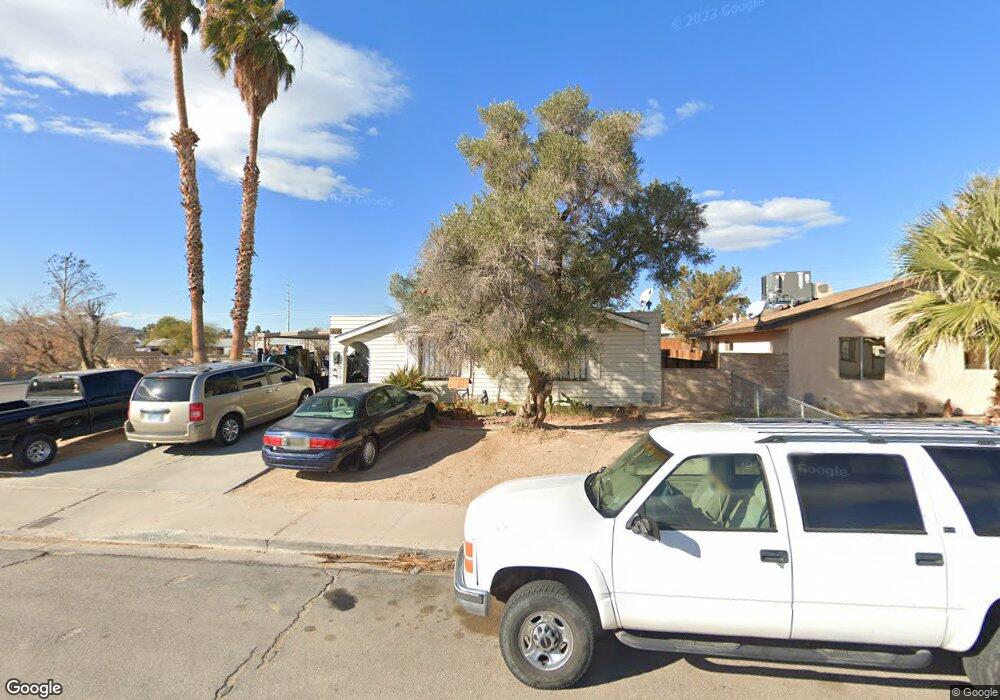
4995 Arvada Way Las Vegas, NV 89122
Estimated Value: $273,994 - $330,000
2
Beds
1
Bath
864
Sq Ft
$346/Sq Ft
Est. Value
About This Home
This home is located at 4995 Arvada Way, Las Vegas, NV 89122 and is currently estimated at $299,249, approximately $346 per square foot. 4995 Arvada Way is a home located in Clark County with nearby schools including Whitney Elementary School and Francis H Cortney Junior High School.
Ownership History
Date
Name
Owned For
Owner Type
Purchase Details
Closed on
Oct 29, 2001
Sold by
Hamblet Gregory and Squire Hamblet Kelly
Bought by
Chaparro Jose L and Chaparro Emmanuel M
Current Estimated Value
Home Financials for this Owner
Home Financials are based on the most recent Mortgage that was taken out on this home.
Original Mortgage
$94,158
Outstanding Balance
$37,127
Interest Rate
6.84%
Mortgage Type
FHA
Estimated Equity
$262,122
Purchase Details
Closed on
Aug 30, 2000
Sold by
Hamblet Kelly Squire
Bought by
Hamblet Gregory and Hamblet Kelly Squire
Home Financials for this Owner
Home Financials are based on the most recent Mortgage that was taken out on this home.
Original Mortgage
$14,400
Interest Rate
8.2%
Purchase Details
Closed on
Dec 21, 1999
Sold by
Hamblet Gregory
Bought by
Hamblet Kelly Squire
Purchase Details
Closed on
Nov 9, 1999
Sold by
Schreur Betty Jo and Dechery Laurie
Bought by
Squire Schoonover Kelly Jeans
Create a Home Valuation Report for This Property
The Home Valuation Report is an in-depth analysis detailing your home's value as well as a comparison with similar homes in the area
Home Values in the Area
Average Home Value in this Area
Purchase History
| Date | Buyer | Sale Price | Title Company |
|---|---|---|---|
| Chaparro Jose L | $95,000 | United Title | |
| Hamblet Gregory | -- | Nevada Title Company | |
| Hamblet Kelly Squire | $70,000 | Fidelity National Title Agen | |
| Hamblet Kelly Squire | $70,000 | Fidelity National Title Agen | |
| Squire Schoonover Kelly Jeans | $70,000 | Fidelity National Title |
Source: Public Records
Mortgage History
| Date | Status | Borrower | Loan Amount |
|---|---|---|---|
| Open | Chaparro Jose L | $94,158 | |
| Previous Owner | Hamblet Gregory | $14,400 |
Source: Public Records
Tax History Compared to Growth
Tax History
| Year | Tax Paid | Tax Assessment Tax Assessment Total Assessment is a certain percentage of the fair market value that is determined by local assessors to be the total taxable value of land and additions on the property. | Land | Improvement |
|---|---|---|---|---|
| 2025 | $604 | $36,846 | $24,500 | $12,346 |
| 2024 | $560 | $36,846 | $24,500 | $12,346 |
| 2023 | $373 | $40,188 | $29,050 | $11,138 |
| 2022 | $519 | $36,217 | $26,250 | $9,967 |
| 2021 | $481 | $28,844 | $19,600 | $9,244 |
| 2020 | $443 | $25,430 | $16,450 | $8,980 |
| 2019 | $416 | $24,240 | $15,050 | $9,190 |
| 2018 | $397 | $23,128 | $14,000 | $9,128 |
| 2017 | $659 | $22,481 | $12,950 | $9,531 |
| 2016 | $373 | $17,520 | $7,350 | $10,170 |
| 2015 | $370 | $16,534 | $7,350 | $9,184 |
| 2014 | $360 | $12,708 | $5,250 | $7,458 |
Source: Public Records
Map
Nearby Homes
- 4990 Denning St
- 4847 Double Down Dr Unit 101
- 4905 Quiet Morning St
- 5536 Baccarat Ave Unit 101
- 4788 Double Down Dr Unit 101
- 5284 Wellesley Ave
- 5507 Big Red Ct Unit 101
- 5359 Chattanooga Ave
- 4976 Quiet Morning St
- 5750 E Hacienda Ave Unit 203
- 5750 E Hacienda Ave Unit 202
- 5750 E Hacienda Ave Unit 117
- 4768 Longshot Dr
- 5068 Killarney St
- 5289 Chattanooga Ave
- 4808 Everman Dr
- 5751 E Hacienda Ave Unit 159
- 5751 E Hacienda Ave Unit 142
- 5751 E Hacienda Ave Unit 243
- 5751 E Hacienda Ave Unit 244
- 4987 Arvada Way
- 5000 Andover Dr
- 4990 Andover Dr
- 5023 Arvada Way
- 4979 Arvada Way
- 4982 Andover Dr
- 4992 Arvada Way
- 5024 Andover Dr
- 4984 Arvada Way
- 4974 Andover Dr
- 5031 Arvada Way
- 4971 Arvada Way
- 4976 Arvada Way
- 5541 Adrian Cir
- 5551 Adrian Cir
- 4966 Andover Dr
- 5039 Arvada Way
- 5040 Andover Dr
- 5450 Aurora Ct
- 5561 Adrian Cir