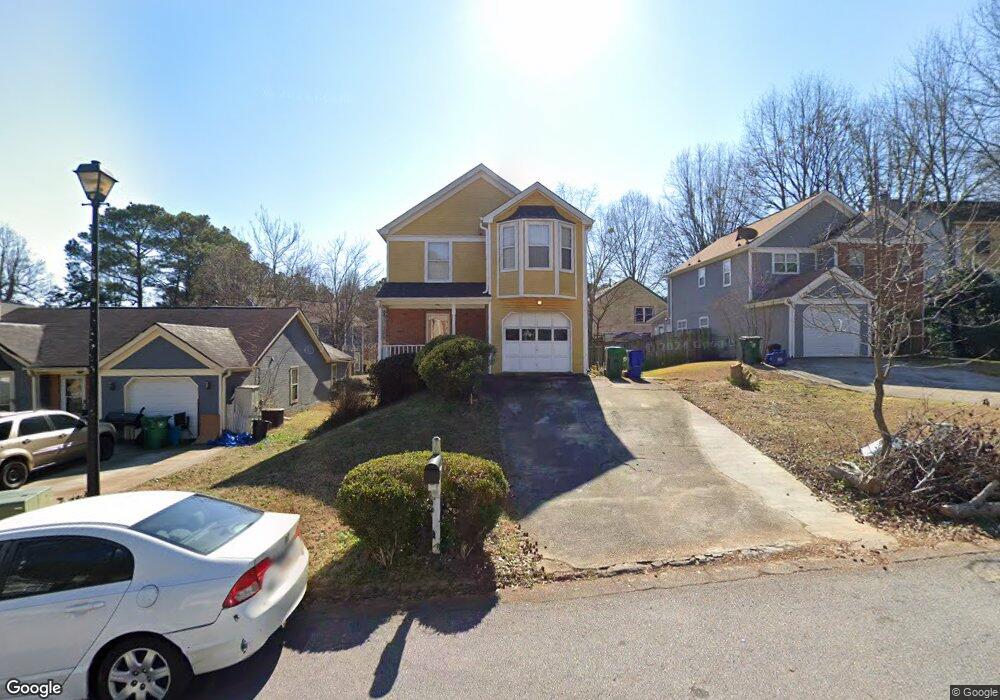
4995 Celtic Way Stone Mountain, GA 30083
Estimated Value: $219,000 - $287,000
3
Beds
3
Baths
1,552
Sq Ft
$157/Sq Ft
Est. Value
About This Home
This home is located at 4995 Celtic Way, Stone Mountain, GA 30083 and is currently estimated at $243,406, approximately $156 per square foot. 4995 Celtic Way is a home located in DeKalb County with nearby schools including Rockbridge Elementary School, Stone Mountain Middle School, and Stone Mountain High School.
Ownership History
Date
Name
Owned For
Owner Type
Purchase Details
Closed on
Oct 1, 2008
Sold by
Impac Secured Assets 2005-2
Bought by
Beyene Mastewal
Current Estimated Value
Home Financials for this Owner
Home Financials are based on the most recent Mortgage that was taken out on this home.
Original Mortgage
$56,700
Outstanding Balance
$37,423
Interest Rate
6.36%
Mortgage Type
New Conventional
Estimated Equity
$205,983
Purchase Details
Closed on
May 6, 2008
Sold by
West Stacyan
Bought by
Well Fargo Series 2005-2
Purchase Details
Closed on
Oct 20, 2004
Sold by
Baugh Barrett and Baugh Latrice
Bought by
West Stacyan
Home Financials for this Owner
Home Financials are based on the most recent Mortgage that was taken out on this home.
Original Mortgage
$26,200
Interest Rate
5.62%
Mortgage Type
Stand Alone Refi Refinance Of Original Loan
Purchase Details
Closed on
Jun 7, 1994
Sold by
Chemical Mtg
Bought by
Secretary Of Hud
Create a Home Valuation Report for This Property
The Home Valuation Report is an in-depth analysis detailing your home's value as well as a comparison with similar homes in the area
Home Values in the Area
Average Home Value in this Area
Purchase History
| Date | Buyer | Sale Price | Title Company |
|---|---|---|---|
| Beyene Mastewal | $63,000 | -- | |
| Well Fargo Series 2005-2 | $89,165 | -- | |
| West Stacyan | $131,000 | -- | |
| Secretary Of Hud | -- | -- | |
| Chemical Mtg | $91,400 | -- |
Source: Public Records
Mortgage History
| Date | Status | Borrower | Loan Amount |
|---|---|---|---|
| Open | Beyene Mastewal | $56,700 | |
| Previous Owner | West Stacyan | $26,200 |
Source: Public Records
Tax History
| Year | Tax Paid | Tax Assessment Tax Assessment Total Assessment is a certain percentage of the fair market value that is determined by local assessors to be the total taxable value of land and additions on the property. | Land | Improvement |
|---|---|---|---|---|
| 2025 | $4,035 | $99,720 | $30,000 | $69,720 |
| 2024 | $3,961 | $96,720 | $30,000 | $66,720 |
| 2023 | $3,961 | $104,240 | $30,000 | $74,240 |
Source: Public Records
Map
Nearby Homes
- 5000 Saxony Ct
- 891 Churchill Ct
- 883 Mountain View Dr
- 730 Brittany Ct
- 4970 Villager Ln
- 4968 Villager Ln
- 4964 Villager Ln
- 4962 Villager Ln
- 4960 Villager Ln
- 4958 Villager Ln
- 742 Mountain View Dr
- 4941 Mountainside Trail
- 5092 Stone Trace
- 754 Garden View Dr
- 904 Pine Roc Dr
- 799 Pine Roc Dr
- 850 Sheppard Cove Unit 1
- 646 Garden Walk Dr
- 929 Pine Roc Dr
- 5191 Stone Trace
- 4991 Celtic Way
- 4999 Celtic Way
- 4999 Celtic Way
- 4996 Saxony Ct
- 4987 Celtic Way Unit Basement apartment
- 4987 Celtic Way Unit top and middle floor
- 4987 Celtic Way
- 5003 Celtic Way
- 4998 Saxony Ct
- 839 Churchill Ct
- 4996 Celtic Way
- 4990 Celtic Way
- 5000 Celtic Way
- 5007 Celtic Way
- 5004 Celtic Way
- 850 Churchill Ct
- 832 Leland Ct
- 5009 Celtic Way
- 858 Churchill Ct
- 887 Churchill Ct
Your Personal Tour Guide
Ask me questions while you tour the home.