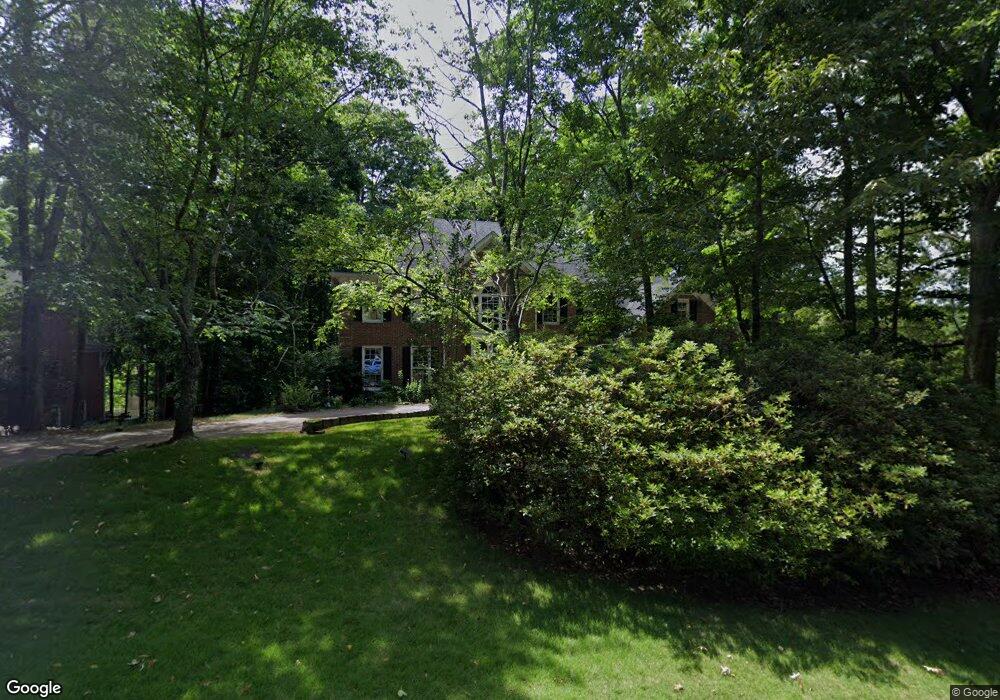
4995 Gunners Run NE Roswell, GA 30075
Estimated Value: $621,000 - $778,000
5
Beds
4
Baths
2,968
Sq Ft
$226/Sq Ft
Est. Value
About This Home
This home is located at 4995 Gunners Run NE, Roswell, GA 30075 and is currently estimated at $671,862, approximately $226 per square foot. 4995 Gunners Run NE is a home located in Cherokee County with nearby schools including Arnold Mill Elementary School, Mill Creek Middle School, and River Ridge High School.
Ownership History
Date
Name
Owned For
Owner Type
Purchase Details
Closed on
Mar 23, 2019
Sold by
Barton Bridget
Bought by
Scott Bridget
Current Estimated Value
Purchase Details
Closed on
Jul 9, 2010
Sold by
Berman E Family Trust
Bought by
Barton Bridget and Scott John
Home Financials for this Owner
Home Financials are based on the most recent Mortgage that was taken out on this home.
Original Mortgage
$205,236
Interest Rate
4.73%
Mortgage Type
FHA
Purchase Details
Closed on
Apr 16, 2007
Sold by
Berman Eugenia Q
Bought by
Berman Eugenia Family Trust
Create a Home Valuation Report for This Property
The Home Valuation Report is an in-depth analysis detailing your home's value as well as a comparison with similar homes in the area
Home Values in the Area
Average Home Value in this Area
Purchase History
| Date | Buyer | Sale Price | Title Company |
|---|---|---|---|
| Scott Bridget | -- | -- | |
| Barton Bridget | $208,000 | -- | |
| Berman Eugenia Family Trust | -- | -- |
Source: Public Records
Mortgage History
| Date | Status | Borrower | Loan Amount |
|---|---|---|---|
| Previous Owner | Barton Bridget | $205,236 |
Source: Public Records
Tax History Compared to Growth
Tax History
| Year | Tax Paid | Tax Assessment Tax Assessment Total Assessment is a certain percentage of the fair market value that is determined by local assessors to be the total taxable value of land and additions on the property. | Land | Improvement |
|---|---|---|---|---|
| 2025 | $6,224 | $236,996 | $37,960 | $199,036 |
| 2024 | $5,633 | $216,752 | $24,480 | $192,272 |
| 2023 | $5,709 | $219,668 | $24,480 | $195,188 |
| 2022 | $3,694 | $140,544 | $24,480 | $116,064 |
| 2021 | $3,334 | $117,440 | $24,480 | $92,960 |
| 2020 | $3,085 | $108,560 | $25,720 | $82,840 |
| 2019 | $3,069 | $108,000 | $24,480 | $83,520 |
| 2018 | $2,973 | $104,000 | $24,480 | $79,520 |
| 2017 | $2,685 | $253,600 | $24,480 | $76,960 |
| 2016 | $2,685 | $230,600 | $21,000 | $71,240 |
| 2015 | $2,651 | $225,400 | $18,000 | $72,160 |
| 2014 | $2,526 | $214,400 | $15,480 | $70,280 |
Source: Public Records
Map
Nearby Homes
- 1945 Ledieu Rd
- 5023 Gunners Run NE
- 235 Foxley Way
- 4973 Gunners Pass NE
- 12180 Lonsdale Ln
- 4383 Capstone Ct NE
- 989 Wiley Bridge Rd
- 4304 Lindsey Way NE
- 123 Ivey Way
- 2000 Trotters Ridge Way Unit 2B
- 519 Magnolia Dr
- 1001 Wiley Bridge Rd
- 706 Magnolia Way
- 226 Parc View Ln
- 1003 Wiley Bridge Rd
- 475 Laurian View Ct
- 0 Gunners Run
- 4993 Gunners Run NE
- 5003 Gunners Run NE
- 4996 Gunners Run NE
- 4994 Gunners Run NE
- 5000 Ledieu Rd
- 4991 Gunners Run NE
- 5005 Gunners Run NE
- 4999 Gunners Run NE
- 4992 Gunners Run NE
- 5007 Gunners Run NE
- 5018 Ledieu Rd
- 4001 Pond View Ct Unit 2
- 4990 Gunners Run NE
- 4999 Ledieu Rd
- 5009 Gunners Run NE
- 4003 Pond View Ct Unit 2
- 4003 Pondview Ct
- 5020 Ledieu Rd Unit 2
- 4988 Gunners Run NE Unit 1