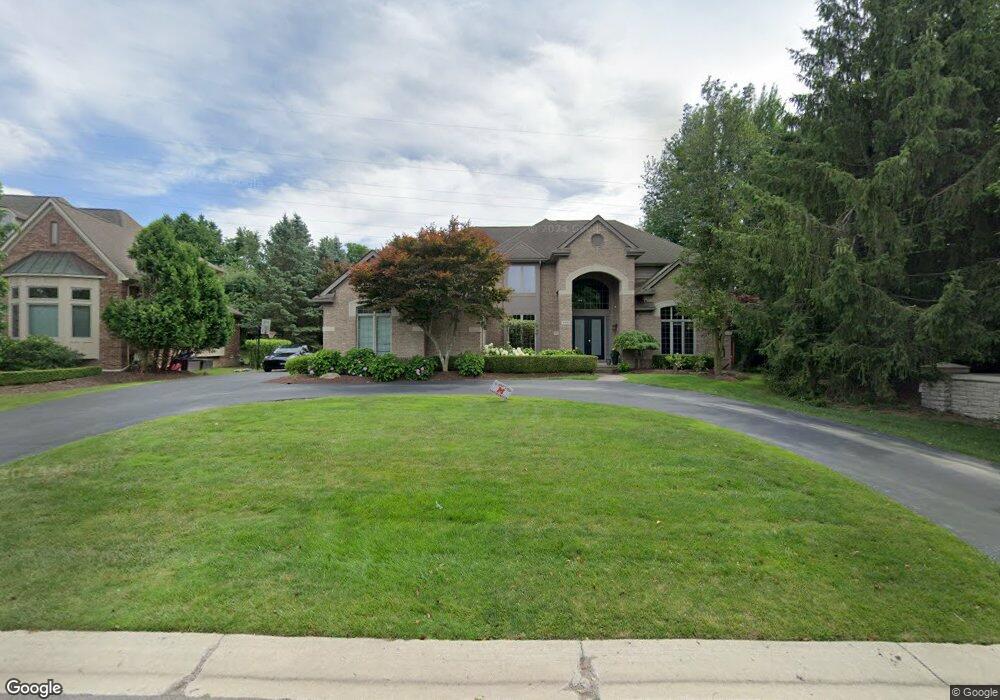
4996 Browning Dr Unit 1 West Bloomfield, MI 48323
Estimated Value: $670,694 - $1,202,000
4
Beds
6
Baths
3,902
Sq Ft
$240/Sq Ft
Est. Value
About This Home
This home is located at 4996 Browning Dr Unit 1, West Bloomfield, MI 48323 and is currently estimated at $937,174, approximately $240 per square foot. 4996 Browning Dr Unit 1 is a home located in Oakland County with nearby schools including Sheiko Elementary School, West Bloomfield Middle School, and Brookfield Academy - West Bloomfield.
Ownership History
Date
Name
Owned For
Owner Type
Purchase Details
Closed on
Dec 30, 2019
Sold by
Najor Edsel and Mansour Kristin
Bought by
Mansour Jason and Mansour Kristin
Current Estimated Value
Home Financials for this Owner
Home Financials are based on the most recent Mortgage that was taken out on this home.
Original Mortgage
$306,000
Outstanding Balance
$206,718
Interest Rate
3.1%
Mortgage Type
New Conventional
Estimated Equity
$730,456
Purchase Details
Closed on
Dec 20, 2010
Sold by
Asher Kevin F and Asher Essie A
Bought by
Najor Edsel
Purchase Details
Closed on
Aug 14, 2000
Sold by
Howard Stanley Custom Ho
Bought by
Asher Kevin F
Home Financials for this Owner
Home Financials are based on the most recent Mortgage that was taken out on this home.
Original Mortgage
$532,000
Interest Rate
8.12%
Mortgage Type
Purchase Money Mortgage
Purchase Details
Closed on
Oct 26, 1998
Sold by
American Quality Homes I
Bought by
Howard Stanley Custom Homes
Create a Home Valuation Report for This Property
The Home Valuation Report is an in-depth analysis detailing your home's value as well as a comparison with similar homes in the area
Home Values in the Area
Average Home Value in this Area
Purchase History
| Date | Buyer | Sale Price | Title Company |
|---|---|---|---|
| Mansour Jason | -- | Cislo Title Co | |
| Najor Edsel | $425,000 | None Available | |
| Asher Kevin F | $664,900 | -- | |
| Howard Stanley Custom Homes | $110,000 | -- |
Source: Public Records
Mortgage History
| Date | Status | Borrower | Loan Amount |
|---|---|---|---|
| Open | Mansour Jason | $306,000 | |
| Previous Owner | Asher Kevin F | $532,000 |
Source: Public Records
Tax History Compared to Growth
Tax History
| Year | Tax Paid | Tax Assessment Tax Assessment Total Assessment is a certain percentage of the fair market value that is determined by local assessors to be the total taxable value of land and additions on the property. | Land | Improvement |
|---|---|---|---|---|
| 2024 | $8,249 | $259,890 | $0 | $0 |
| 2023 | $8,000 | $251,050 | $0 | $0 |
| 2022 | $7,666 | $245,850 | $0 | $0 |
| 2021 | $8,497 | $244,430 | $0 | $0 |
| 2020 | $12,363 | $260,160 | $0 | $0 |
| 2019 | $8,470 | $261,540 | $0 | $0 |
| 2018 | $8,328 | $261,240 | $0 | $0 |
| 2017 | $8,197 | $257,840 | $0 | $0 |
| 2016 | $8,273 | $244,060 | $0 | $0 |
| 2015 | -- | $246,720 | $0 | $0 |
| 2014 | -- | $238,780 | $0 | $0 |
| 2011 | -- | $226,710 | $0 | $0 |
Source: Public Records
Map
Nearby Homes
- 4826 Cliffside Dr Unit 18
- 4832 Cliffside Dr Unit 21
- 4825 Mirror Lake Dr
- 0000 Cranbrook Trail
- 5215 Deer Run Cir
- 7836 Trailside Ct
- 7230 Walnut Lake Lot 1 Rd
- 0000 Orchard Lake
- 7230 Walnut Lake Rd - Lot 2 Rd
- 4841 Leesburg Dr
- 5130 Lake Bluff Rd
- 4163 Old Dominion Dr
- 4205 Hardwoods Dr
- 5353 W Bloomfield Lake Rd
- 4371 Foxpointe Dr Unit 4
- 4291 Foxpointe Dr
- 4343 Foxpointe Dr Unit 39
- 5435 Tequesta Dr
- 4426 Knightsbridge Ln
- 4408 Knightsbridge Ln
- 4980 Browning Dr
- 4679 Mirror Lake Dr
- 4964 Browning #3 L Dr
- 4964 Browning Dr
- 4993 Browning Dr
- 4977 Browning Dr Unit 24
- 4689 Mirror Lake Dr
- 4680 Mirror Lake Dr
- 4948 Browning Dr
- 4922 Panorama Cir
- 5051 Pontiac Trail
- 4928 Panorama Cir
- 4914 Panorama Cir
- 4962 W Strong Ct
- 4690 Mirror Lake Dr
- 4935 Browning Dr
- 4707 Mirror Lake Dr
- 4932 Browning Dr Unit 5
- 4906 Panorama Cir
- 5000 Mirror Lake Ct