Estimated Value: $1,092,000
3
Beds
2
Baths
2,211
Sq Ft
$494/Sq Ft
Est. Value
About This Home
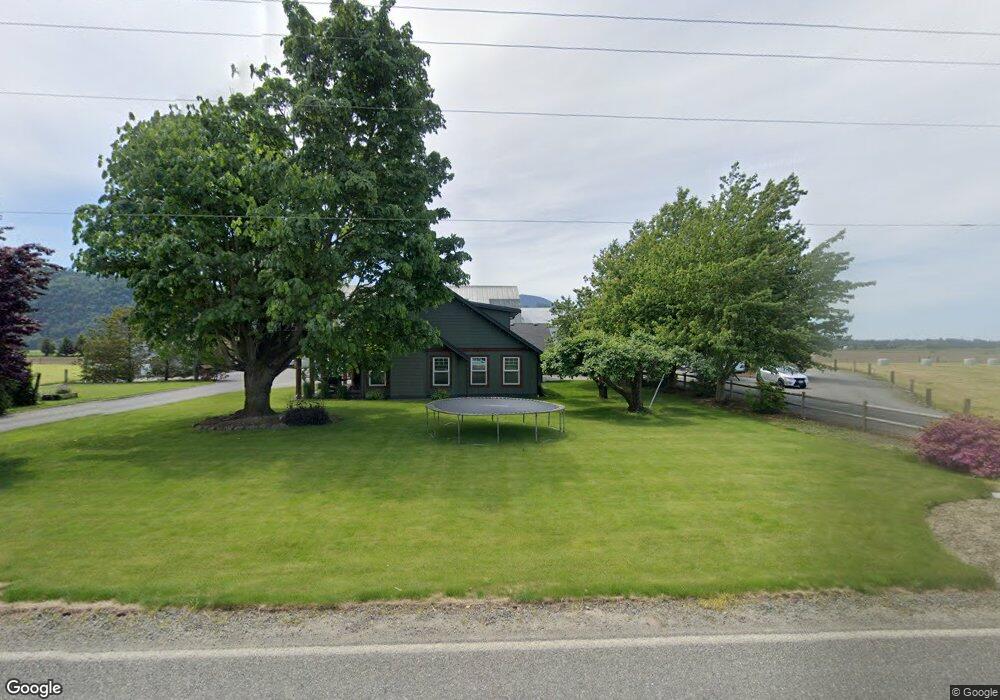
This home is located at 4997 Rock Rd, Sumas, WA 98295 and is currently estimated at $1,092,000, approximately $493 per square foot. 4997 Rock Rd is a home located in Whatcom County with nearby schools including Sumas Elementary School, Nooksack Elementary School, and Everson Elementary School.
Ownership History
Date
Name
Owned For
Owner Type
Purchase Details
Closed on
Nov 18, 2019
Sold by
Demooy Richard J
Bought by
Demooy Richard J and Demooy Janice L
Current Estimated Value
Home Financials for this Owner
Home Financials are based on the most recent Mortgage that was taken out on this home.
Original Mortgage
$222,000
Outstanding Balance
$195,497
Interest Rate
3.65%
Mortgage Type
New Conventional
Estimated Equity
$896,503
Purchase Details
Closed on
Feb 21, 2002
Sold by
Demooy Janice L
Bought by
Demooy Richard J
Purchase Details
Closed on
Nov 7, 2000
Sold by
Mellema Dick A and Mellema Esther R
Bought by
Vreugdenhil Marvin and Vreugdenhil Bernice
Home Financials for this Owner
Home Financials are based on the most recent Mortgage that was taken out on this home.
Original Mortgage
$102,000
Interest Rate
7.88%
Create a Home Valuation Report for This Property
The Home Valuation Report is an in-depth analysis detailing your home's value as well as a comparison with similar homes in the area
Home Values in the Area
Average Home Value in this Area
Purchase History
| Date | Buyer | Sale Price | Title Company |
|---|---|---|---|
| Demooy Richard J | -- | Accommodation | |
| Demooy Richard J | -- | Stewart Title | |
| Demooy Richard J | -- | Stewart Title | |
| Vreugdenhil Marvin | -- | -- | |
| Demooy Jack | -- | -- | |
| Demooy Richard J | $170,000 | -- |
Source: Public Records
Mortgage History
| Date | Status | Borrower | Loan Amount |
|---|---|---|---|
| Open | Demooy Richard J | $222,000 | |
| Closed | Demooy Richard J | $102,000 |
Source: Public Records
Tax History Compared to Growth
Tax History
| Year | Tax Paid | Tax Assessment Tax Assessment Total Assessment is a certain percentage of the fair market value that is determined by local assessors to be the total taxable value of land and additions on the property. | Land | Improvement |
|---|---|---|---|---|
| 2024 | $4,344 | $782,532 | $372,000 | $410,532 |
| 2023 | $4,344 | $601,183 | $198,370 | $402,813 |
| 2022 | $3,557 | $541,614 | $178,714 | $362,900 |
| 2021 | $3,539 | $423,128 | $139,618 | $283,510 |
| 2020 | $2,820 | $275,062 | $34,800 | $240,262 |
| 2019 | $2,373 | $300,980 | $106,804 | $194,176 |
| 2018 | $3,195 | $215,442 | $30,000 | $185,442 |
| 2017 | $2,733 | $218,753 | $30,992 | $187,761 |
| 2016 | $2,726 | $194,895 | $27,612 | $167,283 |
| 2015 | $2,327 | $194,895 | $27,612 | $167,283 |
| 2014 | -- | $189,892 | $32,218 | $157,674 |
| 2013 | -- | $186,471 | $31,316 | $155,155 |
Source: Public Records
Map
Nearby Homes
- 5326 Reese Hill Rd
- 4355 Jones Rd
- 5376 Reese Hill Rd
- 48 XX Reese Hill Rd
- 5363 Reese Hill Rd
- 555 Morton St
- 230 Gough St
- 242 Morton St
- 217 Noble St
- 310 Second St
- 124 Columbia St
- 136 First St
- 1005 Johnson St
- 5615 S Pass Rd
- 6801 S Pass Rd
- 4135 Kamphouse Dr
- 9523 Heady Rd
- 6159 Hawthorne Place
- 8532 Juniper Place
- 1017 Maple Ln