Estimated Value: $452,000 - $476,000
4
Beds
3
Baths
1,900
Sq Ft
$244/Sq Ft
Est. Value
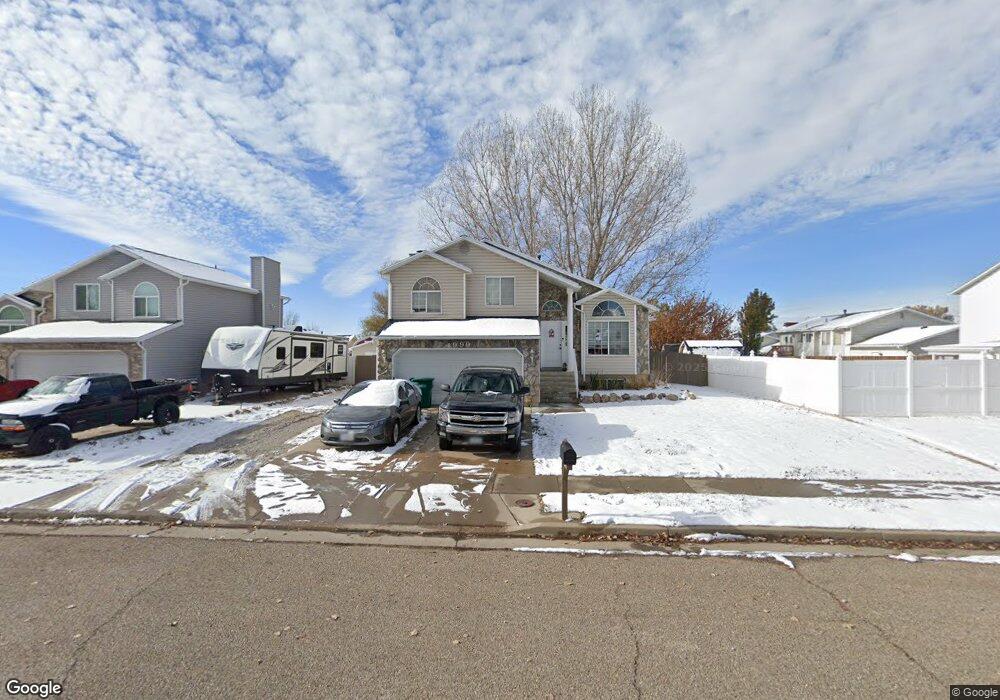
About This Home
This home is located at 4999 S 3300 W, Roy, UT 84067 and is currently estimated at $464,288, approximately $244 per square foot. 4999 S 3300 W is a home located in Weber County with nearby schools including Midland School, Sand Ridge Junior High School, and Roy High School.
Ownership History
Date
Name
Owned For
Owner Type
Purchase Details
Closed on
May 17, 2022
Sold by
Smith Chad W and Smith Julie K
Bought by
Buwalda Nicole E and Mortensen Michelle Elaine
Current Estimated Value
Home Financials for this Owner
Home Financials are based on the most recent Mortgage that was taken out on this home.
Original Mortgage
$372,405
Outstanding Balance
$352,972
Interest Rate
5%
Mortgage Type
New Conventional
Estimated Equity
$111,316
Purchase Details
Closed on
Jul 30, 2009
Sold by
Smith Julie K
Bought by
Smith Chad W
Home Financials for this Owner
Home Financials are based on the most recent Mortgage that was taken out on this home.
Original Mortgage
$169,083
Interest Rate
5.31%
Mortgage Type
FHA
Create a Home Valuation Report for This Property
The Home Valuation Report is an in-depth analysis detailing your home's value as well as a comparison with similar homes in the area
Home Values in the Area
Average Home Value in this Area
Purchase History
| Date | Buyer | Sale Price | Title Company |
|---|---|---|---|
| Buwalda Nicole E | -- | None Listed On Document | |
| Smith Chad W | -- | Lincoln Title Ins Agency | |
| Smith Julie K | -- | Lincoln Title Ins Agency |
Source: Public Records
Mortgage History
| Date | Status | Borrower | Loan Amount |
|---|---|---|---|
| Open | Buwalda Nicole E | $372,405 | |
| Previous Owner | Smith Julie K | $169,083 |
Source: Public Records
Tax History Compared to Growth
Tax History
| Year | Tax Paid | Tax Assessment Tax Assessment Total Assessment is a certain percentage of the fair market value that is determined by local assessors to be the total taxable value of land and additions on the property. | Land | Improvement |
|---|---|---|---|---|
| 2025 | $2,773 | $441,250 | $143,518 | $297,732 |
| 2024 | $2,708 | $238,699 | $78,941 | $159,758 |
| 2023 | $2,566 | $226,050 | $67,930 | $158,120 |
| 2022 | $2,668 | $242,550 | $62,525 | $180,025 |
| 2021 | $2,101 | $312,000 | $83,732 | $228,268 |
| 2020 | $2,039 | $279,000 | $83,732 | $195,268 |
| 2019 | $1,972 | $254,000 | $47,990 | $206,010 |
| 2018 | $1,874 | $227,000 | $42,946 | $184,054 |
| 2017 | $1,639 | $184,000 | $42,946 | $141,054 |
| 2016 | $1,608 | $97,315 | $23,090 | $74,225 |
| 2015 | $1,412 | $86,611 | $23,090 | $63,521 |
| 2014 | $1,385 | $83,916 | $23,090 | $60,826 |
Source: Public Records
Map
Nearby Homes
- 4964 S 3375 W
- 3443 W 5200 S Unit 2&3
- 3509 W 4835 S Unit 26
- 3523 W 4835 S Unit 28
- 3524 W 4835 S Unit 22
- Poplar Plan at Highgate Cove
- Pando Plan at Highgate Cove
- 5321 S 3100 W
- 3046 W 4850 S
- 5009 S 2925 W
- 4918 S 2925 W
- 5432 S 3150 W
- 4891 S 2875 W
- 3014 W 4750 S
- 5003 S 2825 W
- 5063 S 2825 W
- 3607 W 5400 S
- 3627 W 4650 S
- 3671 W 4700 S
- 5173 S 2825 W