49W020 Scott Rd Big Rock, IL 60511
Estimated Value: $671,000 - $1,214,695
--
Bed
1
Bath
4,165
Sq Ft
$208/Sq Ft
Est. Value
About This Home
This home is located at 49W020 Scott Rd, Big Rock, IL 60511 and is currently estimated at $864,898, approximately $207 per square foot. 49W020 Scott Rd is a home located in Kane County with nearby schools including Hinckley-Big Rock Elementary School and Hinckley-Big Rock High School.
Ownership History
Date
Name
Owned For
Owner Type
Purchase Details
Closed on
Jul 30, 2025
Sold by
Delbert A Rhoades Declaration Of Trust and Elaine M Rhoades Declaration Of Trust
Bought by
Bruce E Rhoades Declaration Of Trust and Brian L Rhoades Declaration Of Trust
Current Estimated Value
Purchase Details
Closed on
Nov 2, 2006
Sold by
The Old Second National Bank Of Aurora
Bought by
Rhoades Brian L and Rhoades Bruce E
Purchase Details
Closed on
Feb 17, 2004
Sold by
The Old Second National Bank Of Aurora
Bought by
The Old Second National Bank Of Aurora and Delbert A & Elaine M Rhoades Irrevocable
Purchase Details
Closed on
Dec 16, 1998
Sold by
Rhoades Delbert A and Rhoades Elaine M
Bought by
The Delbert A Rhoades Declaration Of Tr
Purchase Details
Closed on
Oct 7, 1998
Sold by
Rhoades Delbert A and Rhoades Elaine M
Bought by
Delbert A Rhoades Declaration Of Trust
Purchase Details
Closed on
Oct 2, 1998
Sold by
Rhoades Delbert A and Rhoades Elaine A
Bought by
Elaine M Rhoades Declaration Of Trust
Create a Home Valuation Report for This Property
The Home Valuation Report is an in-depth analysis detailing your home's value as well as a comparison with similar homes in the area
Home Values in the Area
Average Home Value in this Area
Purchase History
| Date | Buyer | Sale Price | Title Company |
|---|---|---|---|
| Bruce E Rhoades Declaration Of Trust | -- | None Listed On Document | |
| Rhoades Brian L | -- | None Available | |
| The Old Second National Bank Of Aurora | $240,000 | -- | |
| The Delbert A Rhoades Declaration Of Tr | -- | -- | |
| The Elaine M Rhoades Declaration Of Tr | -- | -- | |
| Delbert A Rhoades Declaration Of Trust | -- | -- | |
| Elaine M Rhoades Declaration Of Trust | -- | -- |
Source: Public Records
Tax History Compared to Growth
Tax History
| Year | Tax Paid | Tax Assessment Tax Assessment Total Assessment is a certain percentage of the fair market value that is determined by local assessors to be the total taxable value of land and additions on the property. | Land | Improvement |
|---|---|---|---|---|
| 2024 | $23,711 | $346,898 | $141,803 | $205,095 |
| 2023 | $22,937 | $320,135 | $130,863 | $189,272 |
| 2022 | $21,935 | $300,342 | $122,772 | $177,570 |
| 2021 | $21,990 | $282,224 | $115,366 | $166,858 |
| 2020 | $21,596 | $272,575 | $111,422 | $161,153 |
| 2019 | $20,755 | $259,077 | $105,904 | $153,173 |
| 2018 | $20,093 | $237,758 | $102,096 | $135,662 |
| 2017 | $19,460 | $224,852 | $96,554 | $128,298 |
| 2016 | $19,907 | $220,191 | $96,554 | $123,637 |
| 2015 | -- | $204,812 | $94,987 | $109,825 |
| 2014 | -- | $201,385 | $94,987 | $106,398 |
| 2013 | -- | $207,058 | $97,663 | $109,395 |
Source: Public Records
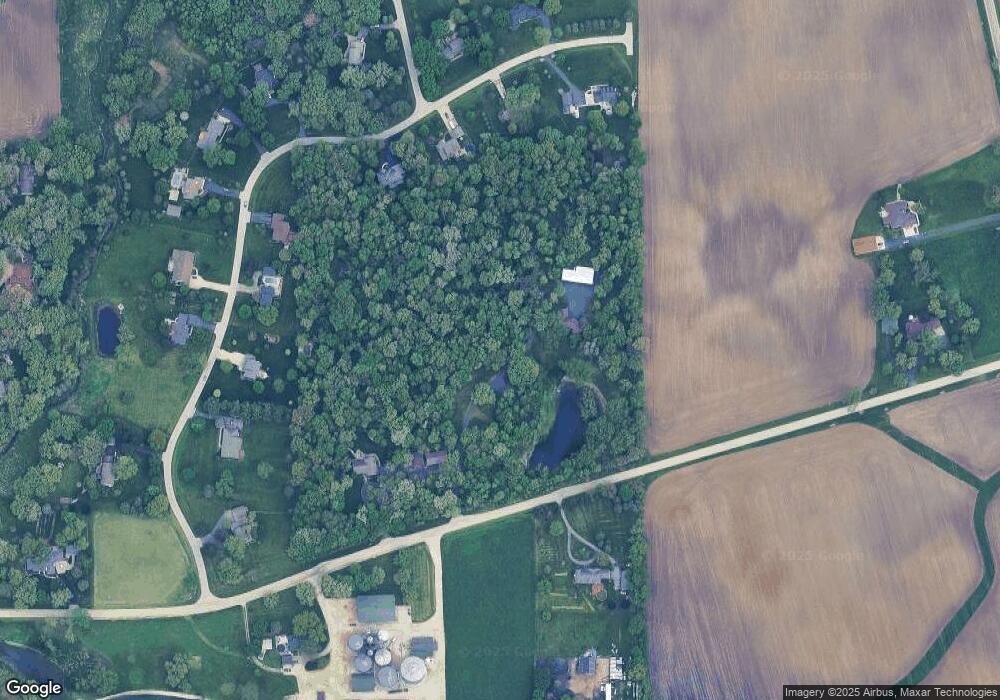
Map
Nearby Homes
- 204 S Lincoln Ave
- 307 Jefferson Ave
- 17751 Scott Rd
- 10266 Pritchard Rd
- 640 Coster Ct
- 527 Prairie St
- 670 Rustic Way
- 631 Rustic Way
- 230 Christensen St
- 320 Harvest Ave
- 210 Christensen St
- 621 N Oak St
- 170 Christensen St
- 520 N Oak St
- 150 Christensen St
- 541 N Oak St
- 408 E Lincoln Ave
- 140 Prairie St
- Starling Plan at Royal Estates
- Wren Plan at Royal Estates
- 49W071 Deer Ridge Path
- 49W048 Scott Rd
- 49W105 Deer Ridge Path
- 49W021 Deer Ridge Path
- 49W151 Deer Ridge Path
- 49W158 Scott Rd
- 0 Deer Ridge Path
- 0 Deer Ridge Path Unit 8847884
- 49W035 Scott Rd
- 48W842 Scott Rd
- 5S331 Deer Ridge Path
- 5S230 Swan Rd
- 5S189 Whitetail Path
- 49W050 Deer Ridge Path
- 5S375 Deer Ridge Path
- 5S206 Whitetail Path
- Lot Deer Ridge Path
- Lot 4 Deer Ridge Path
- 05S390 Deer Ridge Path
- Lot 1 Deer Ridge Path