


49W794 Lenschow Rd Sycamore, IL 60178
Estimated payment $4,740/month
Highlights
- Home fronts a pond
- 5.63 Acre Lot
- Mature Trees
- Howard B. Thomas Grade School Rated 9+
- Landscaped Professionally
- Community Lake
About This Home
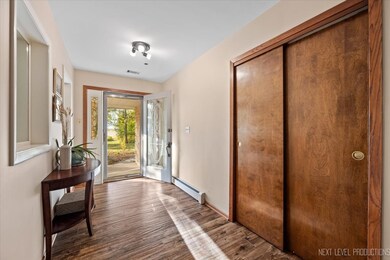
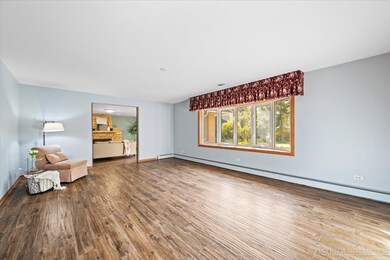
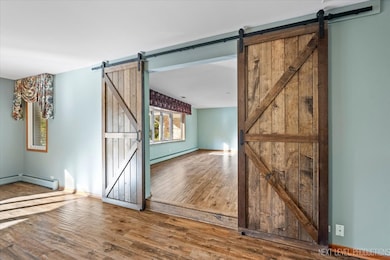
Tucked away on a stunning 5.63-acre lot, this one-of-a-kind Sycamore ranch retreat offers privacy, serenity, and natural beauty at every turn. A peaceful pond greets you at the entrance, setting the tone for what's to come. As you follow the driveway to the home, the beauty of the landscape unfolds around you - a true country welcome. Step inside the foyer and immediately be impressed by the porcelain wood-look tile that flows through much of the main level. This home's thoughtful design and open floor plan make it easy to entertain or enjoy everyday living in style. Just off the foyer is an oversized dining room where holidays and gatherings will be celebrated for years to come. On one end of the room, custom barn doors allow you to close off the space for privacy or open it to reveal the impressive Great Room, where a floor-to-ceiling stone fireplace takes center stage - complete with a custom Brentwood stone hearth that's truly a work of art. Separating the Great Room from the office/mudroom is a floor-to-ceiling wood shelving system with its own set of sliding barn doors. This beautiful functional design element provides the perfect place to display books, family photos, or treasured keepsakes. The office/mudroom has an exterior door offering access to the backyard. The 1/2 bath is adjacent to the office/mudroom which makes cleaning up after spending a day in the yard very convenient. The kitchen, filled with natural light, overlooks the tranquil backyard. A skylight brightens the meal prep area, and sliding glass doors offer a daily "table with a view." For three seasons of the year, you can open those doors and enjoy your meals on the deck just outside. Also on the main level are four spacious bedrooms, including a serene primary suite with sliding glass doors that lead to a private deck - the perfect spot for morning coffee, starlit nights, or quiet sunsets. Both the primary and hall bathrooms were remodeled in 2018 with travertine tile on the floors and showers, creating a spa-like experience in your own home. The lower level offers even more living space! A flexible bonus room can serve as an office, playroom, craft area, or theater room - the possibilities are endless. You'll also find a 23' x 30' family/recreation room with the home's second fireplace, and a wet bar, half bath, laundry room, and tool room. Outside, two more highlights await. First, the incredible 3-car garage with high ceilings and plenty of space for vehicles, storage, or a workshop - perfect for landscapers, mechanics, or hobbyists. Second, the enclosed porch attached to the garage - a peaceful place to pause, relax, and take in the sights of deer and songbirds passing through. The property is adorned with towering oak and hickory trees, plus fruit-bearing cherry, peach, and pear trees, perfect for those who appreciate the gifts of the land. Located in the highly sought-after Central School District 301, this home combines the best of country living with convenient access to all that Sycamore and nearby communities have to offer. Every view, every breeze, and every sunset reminds you that you're home.
Listing Agent
@properties Christie's International Real Estate License #475181032 Listed on: 10/29/2025

Home Details
Home Type
- Single Family
Est. Annual Taxes
- $14,285
Year Built
- Built in 1969
Lot Details
- 5.63 Acre Lot
- Lot Dimensions are 372.01x639.19
- Home fronts a pond
- Landscaped Professionally
- Paved or Partially Paved Lot
- Mature Trees
- Wooded Lot
Parking
- 3 Car Garage
- Driveway
- Parking Included in Price
Home Design
- Ranch Style House
- Brick Exterior Construction
- Asphalt Roof
- Concrete Perimeter Foundation
Interior Spaces
- 3,086 Sq Ft Home
- Central Vacuum
- Bar
- Historic or Period Millwork
- Whole House Fan
- Skylights
- Wood Burning Fireplace
- Bay Window
- Window Screens
- Sliding Doors
- Mud Room
- Entrance Foyer
- Family Room with Fireplace
- 2 Fireplaces
- Great Room with Fireplace
- Living Room
- Formal Dining Room
- Home Office
- Workshop
- Utility Room with Study Area
Kitchen
- Breakfast Bar
- Cooktop
- Dishwasher
- Trash Compactor
- Disposal
Flooring
- Carpet
- Marble
Bedrooms and Bathrooms
- 4 Bedrooms
- 4 Potential Bedrooms
- Dual Sinks
- Separate Shower
Laundry
- Laundry Room
- Dryer
- Washer
- Sink Near Laundry
Basement
- Partial Basement
- Finished Basement Bathroom
Home Security
- Storm Doors
- Carbon Monoxide Detectors
Outdoor Features
- Deck
- Enclosed Patio or Porch
- Shed
Utilities
- Zoned Heating and Cooling System
- Baseboard Heating
- Heating System Uses Steam
- Radiant Heating System
- Heating System Uses Propane
- 200+ Amp Service
- Well
- Gas Water Heater
- Water Softener is Owned
- Septic Tank
Community Details
- Community Lake
Listing and Financial Details
- Homeowner Tax Exemptions
Map
Home Values in the Area
Average Home Value in this Area
Tax History
| Year | Tax Paid | Tax Assessment Tax Assessment Total Assessment is a certain percentage of the fair market value that is determined by local assessors to be the total taxable value of land and additions on the property. | Land | Improvement |
|---|---|---|---|---|
| 2024 | $14,285 | $185,796 | $67,319 | $118,477 |
| 2023 | $13,635 | $167,128 | $60,555 | $106,573 |
| 2022 | $13,962 | $164,434 | $72,994 | $91,440 |
| 2021 | $13,490 | $155,112 | $68,856 | $86,256 |
| 2020 | $13,316 | $150,872 | $66,974 | $83,898 |
| 2019 | $13,945 | $155,772 | $66,974 | $88,798 |
| 2018 | $13,514 | $150,872 | $66,974 | $83,898 |
| 2017 | $13,702 | $150,872 | $66,974 | $83,898 |
| 2016 | $13,763 | $141,823 | $62,957 | $78,866 |
| 2015 | -- | $131,818 | $58,516 | $73,302 |
| 2014 | -- | $127,471 | $56,586 | $70,885 |
| 2013 | -- | $135,622 | $60,204 | $75,418 |
Property History
| Date | Event | Price | List to Sale | Price per Sq Ft |
|---|---|---|---|---|
| 11/09/2025 11/09/25 | Pending | -- | -- | -- |
| 10/29/2025 10/29/25 | For Sale | $675,000 | -- | $219 / Sq Ft |
Purchase History
| Date | Type | Sale Price | Title Company |
|---|---|---|---|
| Interfamily Deed Transfer | -- | Attorney | |
| Warranty Deed | $376,000 | Golden Title | |
| Deed | -- | None Available | |
| Deed | -- | -- |
Mortgage History
| Date | Status | Loan Amount | Loan Type |
|---|---|---|---|
| Previous Owner | $300,800 | New Conventional |
Source: Midwest Real Estate Data (MRED)
MLS Number: 12482207
APN: 01-31-300-041
Disclaimer: Certain information contained herein is derived from information provided by parties other than Homes.com. All information provided is deemed reliable, but is not guaranteed to be accurate and should be independently verified.
![]() Based on information submitted to the MLS GRID. All data is obtained from various sources and may not have been verified by broker or MLS GRID. Supplied Open House Information is subject to change without notice. All information should be independently reviewed and verified for accuracy. Properties may or may not be listed by the office/agent presenting the information. Some IDX listings have been excluded from this website.
Based on information submitted to the MLS GRID. All data is obtained from various sources and may not have been verified by broker or MLS GRID. Supplied Open House Information is subject to change without notice. All information should be independently reviewed and verified for accuracy. Properties may or may not be listed by the office/agent presenting the information. Some IDX listings have been excluded from this website.
The Digital Millennium Copyright Act of 1998, 17 U.S.C. § 512 (the “DMCA”) provides recourse for copyright owners who believe that material appearing on the Internet infringes their rights under U.S. copyright law. If you believe in good faith that any content or material made available in connection with our website or services infringes your copyright, you (or your agent) may send us a notice requesting that the content or material be removed, or access to it blocked.
Notices must be sent in writing by email to DMCAnotice@MLSGrid.com.
The DMCA requires that your notice of alleged copyright infringement include the following information:
(1) description of the copyrighted work that is the subject of claimed infringement;
(2) description of the alleged infringing content and information sufficient to permit us to locate the content;
(3) contact information for you, including your address, telephone number and email address;
(4) a statement by you that you have a good faith belief that the content in the manner complained of is not authorized by the copyright owner, or its agent, or by the operation of any law;
(5) a statement by you, signed under penalty of perjury, that the information in the notification is accurate and that you have the authority to enforce the copyrights that are claimed to be infringed; and
(6) a physical or electronic signature of the copyright owner or a person authorized to act on the copyright owner’s behalf. Failure to include all of the above information may result in the delay of the processing of your complaint.
- 14N700 Factly Rd
- 0 Plank Rd
- 0 Plank Rd
- 300 Rolling Oaks Dr
- LOT 5 Rolling Oaks Dr
- 681 Hampshire Dr
- LOT 37 W Oak Knoll Dr
- 11N315 Mcgough Rd
- 14N693 Getzelman Rd
- 120 Jack Dylan Dr
- 421 Klick St
- Lot 14 Crane Ct
- 895 S State St
- 704 S State St
- 286 Wild Prairie Pointe
- 284 Wild Prairie Pointe
- 283 Wild Prairie Pointe
- 282 Wild Prairie Pointe
- 207 Julie Ln
- Lot 12 Gerry Ln