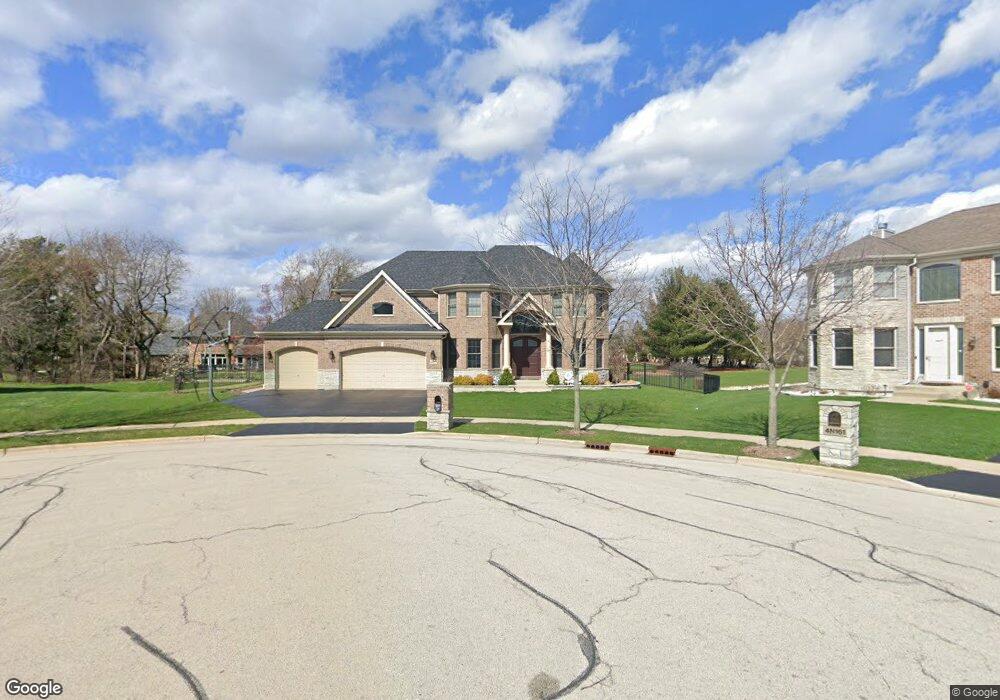
4N171 Golf View Ct West Chicago, IL 60185
Chicago West NeighborhoodEstimated Value: $722,044 - $845,000
4
Beds
4
Baths
4,233
Sq Ft
$182/Sq Ft
Est. Value
About This Home
This home is located at 4N171 Golf View Ct, West Chicago, IL 60185 and is currently estimated at $772,261, approximately $182 per square foot. 4N171 Golf View Ct is a home located in DuPage County with nearby schools including Hawk Hollow Elementary School, Eastview Middle School, and Bartlett High School.
Ownership History
Date
Name
Owned For
Owner Type
Purchase Details
Closed on
Mar 14, 2007
Sold by
Rubino Matthew V and Rubino Meghan M
Bought by
Rubino Meghan and Meghan Rubino Revocable Trust
Current Estimated Value
Purchase Details
Closed on
Oct 31, 2006
Sold by
Grande Terre Llc
Bought by
Rubino Matthew V and Rubino Meghan M
Home Financials for this Owner
Home Financials are based on the most recent Mortgage that was taken out on this home.
Original Mortgage
$417,000
Outstanding Balance
$248,733
Interest Rate
6.36%
Mortgage Type
Purchase Money Mortgage
Estimated Equity
$523,528
Purchase Details
Closed on
Nov 29, 2005
Sold by
Landco Llc
Bought by
Grande Terre Llc
Home Financials for this Owner
Home Financials are based on the most recent Mortgage that was taken out on this home.
Original Mortgage
$1,630,000
Interest Rate
6.38%
Mortgage Type
Purchase Money Mortgage
Create a Home Valuation Report for This Property
The Home Valuation Report is an in-depth analysis detailing your home's value as well as a comparison with similar homes in the area
Home Values in the Area
Average Home Value in this Area
Purchase History
| Date | Buyer | Sale Price | Title Company |
|---|---|---|---|
| Rubino Meghan | -- | None Available | |
| Rubino Matthew V | $787,000 | First American Title | |
| Grande Terre Llc | $330,000 | 1St American Title |
Source: Public Records
Mortgage History
| Date | Status | Borrower | Loan Amount |
|---|---|---|---|
| Open | Rubino Matthew V | $417,000 | |
| Previous Owner | Grande Terre Llc | $1,630,000 |
Source: Public Records
Tax History Compared to Growth
Tax History
| Year | Tax Paid | Tax Assessment Tax Assessment Total Assessment is a certain percentage of the fair market value that is determined by local assessors to be the total taxable value of land and additions on the property. | Land | Improvement |
|---|---|---|---|---|
| 2024 | $15,715 | $226,766 | $48,816 | $177,950 |
| 2023 | $14,447 | $205,740 | $44,290 | $161,450 |
| 2022 | $15,599 | $207,880 | $41,160 | $166,720 |
| 2021 | $15,112 | $197,340 | $39,070 | $158,270 |
| 2020 | $14,772 | $191,430 | $37,900 | $153,530 |
| 2019 | $14,603 | $184,600 | $36,550 | $148,050 |
| 2018 | $15,176 | $185,950 | $36,820 | $149,130 |
| 2017 | $14,966 | $178,540 | $35,350 | $143,190 |
| 2016 | $13,931 | $161,590 | $33,770 | $127,820 |
| 2015 | $14,140 | $152,970 | $31,970 | $121,000 |
| 2014 | $13,137 | $149,090 | $31,160 | $117,930 |
| 2013 | $15,734 | $152,670 | $31,910 | $120,760 |
Source: Public Records
Map
Nearby Homes
- 30W170 Whitney Rd
- 30W010 Smith Rd
- 4N336 Locust Ave
- 4N139 Norris Ave
- 4N707 White Oak Ln
- 30W359 Wiant Rd
- 582 Partridge Dr
- 29W725 Army Trail Rd
- 2625 Bobwhite Ln
- 30W520 Arbor Ln
- 3N234 Cuyahoga Terrace
- 1548 Wood Creek Trail
- 1542 Wood Creek Trail
- 30W030 Schick Rd
- 31W780 North Ave
- 3N050 Timberline Dr
- 1529 Longmeadow Ln
- 1433 Quincy Bridge Ct Unit 37
- 29W548 Cape Ave
- 2N672 Valewood Rd
- 4N161 Golf View Ct
- 4N170 Golf View Ct
- 4N147 Golf View Ct
- 4N160 Golf View Ct
- 30W115 Saint Andrews Ln
- 4N146 Golf View Ct
- 30W071 Saint Andrews Ln
- 4N135 Golf View Ct
- 30W150 Whitney Rd
- 30W064 Whitney Rd
- 4N134 Golf View Ct
- 30W146 Whitney Rd
- 4N172 Doral Dr
- 30W051 Saint Andrews Ln
- 30W140 Whitney Rd
- 30W160 Whitney Rd
- 4N156 Doral Dr
- 30W046 Whitney Rd
- 30W114 Saint Andrews Ln
- 30 Whitney Rd