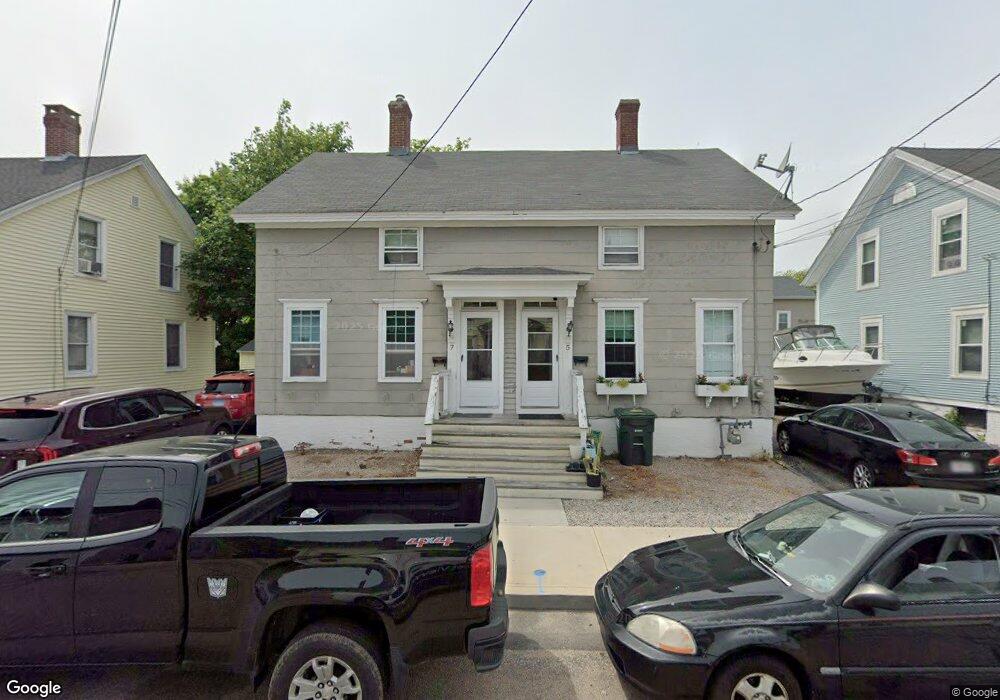
5-7 Wilford Ct Pawcatuck, CT 06379
Estimated Value: $253,000 - $320,000
6
Beds
2
Baths
1,404
Sq Ft
$204/Sq Ft
Est. Value
About This Home
This home is located at 5-7 Wilford Ct, Pawcatuck, CT 06379 and is currently estimated at $286,877, approximately $204 per square foot. 5-7 Wilford Ct is a home located in New London County with nearby schools including Stonington Middle School, Stonington High School, and Pine Point School.
Ownership History
Date
Name
Owned For
Owner Type
Purchase Details
Closed on
Jan 14, 2019
Sold by
Sadler Michael C and Sadler Dana S
Bought by
Michael C & D Sadler Ret
Current Estimated Value
Purchase Details
Closed on
Jun 28, 2013
Sold by
Brjm Llc
Bought by
Sadler Michael C and Sadler Dana S
Purchase Details
Closed on
May 31, 2002
Sold by
Ingalls Gerard W and Ingalls Phyllis
Bought by
Kepple Benjamin M
Create a Home Valuation Report for This Property
The Home Valuation Report is an in-depth analysis detailing your home's value as well as a comparison with similar homes in the area
Home Values in the Area
Average Home Value in this Area
Purchase History
| Date | Buyer | Sale Price | Title Company |
|---|---|---|---|
| Michael C & D Sadler Ret | -- | -- | |
| Michael C & D Sadler Ret | -- | -- | |
| Sadler Michael C | $110,000 | -- | |
| Sadler Michael C | $110,000 | -- | |
| Kepple Benjamin M | $130,000 | -- | |
| Kepple Benjamin M | $130,000 | -- |
Source: Public Records
Mortgage History
| Date | Status | Borrower | Loan Amount |
|---|---|---|---|
| Previous Owner | Kepple Benjamin M | $340,000 | |
| Previous Owner | Kepple Benjamin M | $40,000 | |
| Previous Owner | Kepple Benjamin M | $20,000 |
Source: Public Records
Tax History Compared to Growth
Tax History
| Year | Tax Paid | Tax Assessment Tax Assessment Total Assessment is a certain percentage of the fair market value that is determined by local assessors to be the total taxable value of land and additions on the property. | Land | Improvement |
|---|---|---|---|---|
| 2025 | $2,819 | $141,800 | $45,900 | $95,900 |
| 2024 | $2,701 | $141,800 | $45,900 | $95,900 |
| 2023 | $2,702 | $141,800 | $45,900 | $95,900 |
| 2022 | $2,213 | $86,400 | $40,600 | $45,800 |
| 2021 | $2,216 | $86,400 | $40,600 | $45,800 |
| 2020 | $2,174 | $86,400 | $40,600 | $45,800 |
| 2019 | $2,170 | $86,400 | $40,600 | $45,800 |
| 2018 | $2,096 | $86,400 | $40,600 | $45,800 |
| 2017 | $1,970 | $80,000 | $38,000 | $42,000 |
| 2016 | $1,916 | $80,000 | $38,000 | $42,000 |
| 2015 | $1,798 | $80,000 | $38,000 | $42,000 |
| 2014 | $1,759 | $80,000 | $38,000 | $42,000 |
Source: Public Records
Map
Nearby Homes
- 77 Mechanic St
- 38 Prospect St
- 13 Palmer St
- 52 William St
- 65 Mechanic St
- 52 Prospect St Unit B
- 27 Liberty St
- 25 School St Unit 2
- 49 Lathrop Ave
- 12 Avery St
- 2 Pawcatuck Ave
- 44 George St
- 57 School St
- 38 Newton Ave
- 67 Cross St
- 52 Spruce St
- 140 High St Unit 307
- 19 Pleasant St
- 23 Abbey Ln Unit 12
- 145 High St Unit D
- 57 Wilford Ct
- 5 Wilford Ct
- 9 Wilford Ct Unit 11
- 68 Wilford Ct
- 38 Moss St
- 13 Wilford Ct
- 13 Wilford Ct Unit 15
- 10 Wilford Ct Unit 12
- 14 Wilford Ct Unit 16
- 36 Moss St
- 42 Moss St
- 40 Moss St
- 18 Wilford Ct
- 30 Palmer St
- 34 Moss St
- 20 Wilford Ct
- 32 Palmer St
- 46 Moss St
- 23 Wilford Ct
- 19 & 21 Palmer St (Pawcatuck)