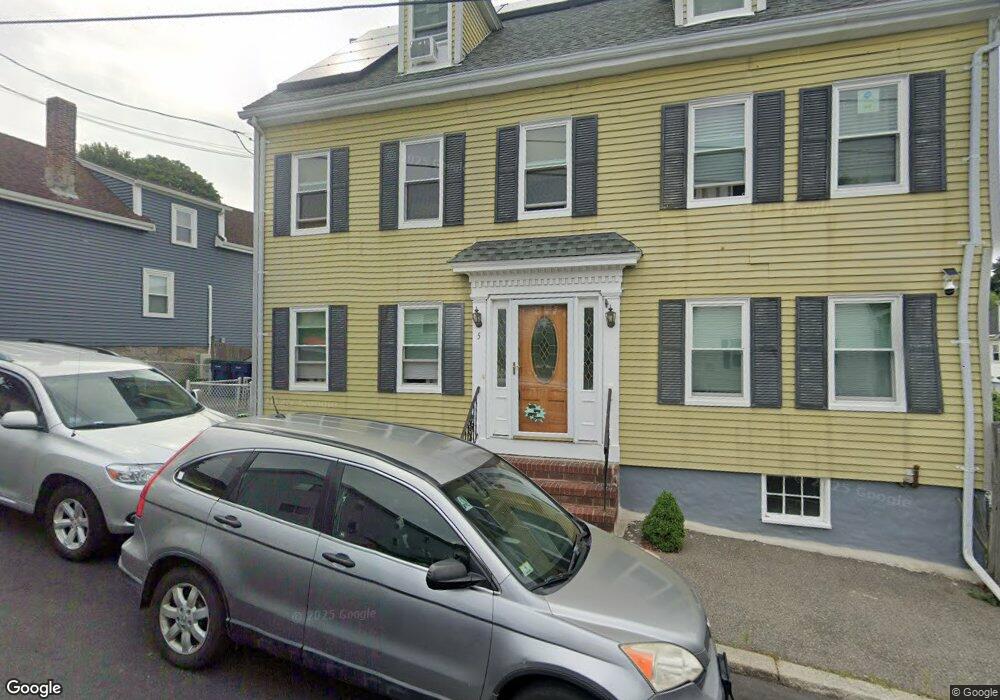
5 Albion St Unit 2 Salem, MA 01970
Gallows Hill NeighborhoodEstimated Value: $633,000 - $711,229
3
Beds
1
Bath
1,750
Sq Ft
$389/Sq Ft
Est. Value
About This Home
This home is located at 5 Albion St Unit 2, Salem, MA 01970 and is currently estimated at $680,807, approximately $389 per square foot. 5 Albion St Unit 2 is a home located in Essex County with nearby schools including Witchcraft Heights Elementary School, Horace Mann Laboratory, and Bates Elementary School.
Ownership History
Date
Name
Owned For
Owner Type
Purchase Details
Closed on
Apr 22, 2020
Sold by
Belleau Ernest R and Dunleavy June C
Bought by
Arias Xiomara E and Medrano Ana L
Current Estimated Value
Home Financials for this Owner
Home Financials are based on the most recent Mortgage that was taken out on this home.
Original Mortgage
$490,943
Outstanding Balance
$431,476
Interest Rate
2.99%
Mortgage Type
FHA
Estimated Equity
$249,331
Purchase Details
Closed on
Apr 30, 2002
Sold by
Giannaros Nart Abb
Bought by
Dunleavy June C and Belleau Ernest R
Home Financials for this Owner
Home Financials are based on the most recent Mortgage that was taken out on this home.
Original Mortgage
$196,000
Interest Rate
7.05%
Mortgage Type
Purchase Money Mortgage
Create a Home Valuation Report for This Property
The Home Valuation Report is an in-depth analysis detailing your home's value as well as a comparison with similar homes in the area
Home Values in the Area
Average Home Value in this Area
Purchase History
| Date | Buyer | Sale Price | Title Company |
|---|---|---|---|
| Arias Xiomara E | $500,000 | None Available | |
| Dunleavy June C | $80,000 | -- |
Source: Public Records
Mortgage History
| Date | Status | Borrower | Loan Amount |
|---|---|---|---|
| Open | Arias Xiomara E | $490,943 | |
| Previous Owner | Dunleavy June C | $68,000 | |
| Previous Owner | Dunleavy June C | $242,000 | |
| Previous Owner | Dunleavy June C | $196,000 |
Source: Public Records
Tax History Compared to Growth
Tax History
| Year | Tax Paid | Tax Assessment Tax Assessment Total Assessment is a certain percentage of the fair market value that is determined by local assessors to be the total taxable value of land and additions on the property. | Land | Improvement |
|---|---|---|---|---|
| 2025 | $6,354 | $560,300 | $209,700 | $350,600 |
| 2024 | $6,106 | $525,500 | $199,300 | $326,200 |
| 2023 | $5,932 | $474,200 | $184,000 | $290,200 |
| 2022 | $6,249 | $471,600 | $177,800 | $293,800 |
| 2021 | $6,127 | $444,000 | $165,600 | $278,400 |
| 2020 | $6,017 | $416,400 | $156,400 | $260,000 |
| 2019 | $5,963 | $394,900 | $148,400 | $246,500 |
| 2018 | $5,541 | $360,300 | $141,000 | $219,300 |
| 2017 | $5,150 | $324,700 | $119,000 | $205,700 |
| 2016 | $5,000 | $319,100 | $113,400 | $205,700 |
| 2015 | $4,852 | $295,700 | $104,200 | $191,500 |
Source: Public Records
Map
Nearby Homes
- 15 Wall St
- 36 Summit St
- 23 Proctor St
- 128 Boston St Unit 4
- 55 Butler St
- 145 Boston St
- 57 Ord St
- 97 Mason St Unit 2
- 2 Hillside Ave
- 35 Flint St Unit 209
- 35 Flint St Unit 106
- 145 Federal St Unit 3
- 38 Valley St
- 2 Osborne St
- 36 Valley St
- 38 Chestnut St
- 36 Irving St Unit B
- 9 Sutton St
- 46 Sutton St
- 119 Highland Ave