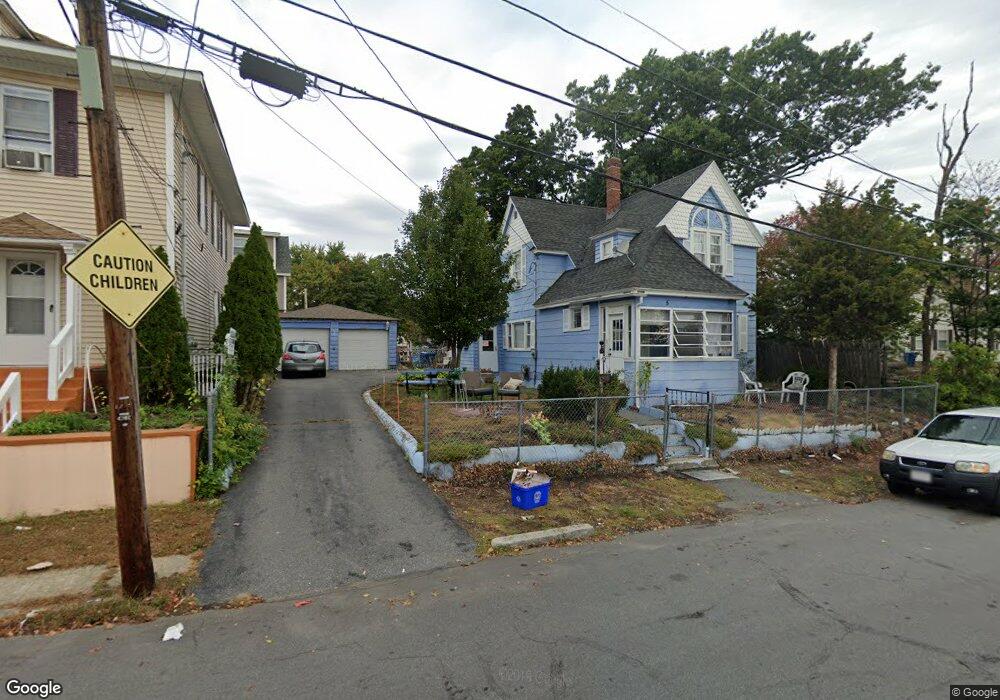
5 Allston St Lawrence, MA 01841
Prospect Hill-Back Bay NeighborhoodEstimated Value: $426,000 - $518,381
3
Beds
1
Bath
1,311
Sq Ft
$370/Sq Ft
Est. Value
About This Home
This home is located at 5 Allston St, Lawrence, MA 01841 and is currently estimated at $484,845, approximately $369 per square foot. 5 Allston St is a home located in Essex County with nearby schools including Olive Branch Elementary School, James F. Hennessey School, and School For Exceptional Studies.
Ownership History
Date
Name
Owned For
Owner Type
Purchase Details
Closed on
Feb 26, 2007
Sold by
Us Bk Na Tr
Bought by
Mateo-Bell Fatima M
Current Estimated Value
Home Financials for this Owner
Home Financials are based on the most recent Mortgage that was taken out on this home.
Original Mortgage
$35,000
Outstanding Balance
$21,150
Interest Rate
6.23%
Mortgage Type
Purchase Money Mortgage
Estimated Equity
$463,695
Purchase Details
Closed on
Jul 31, 1998
Sold by
Phair William H
Bought by
Gomez Emilio A
Home Financials for this Owner
Home Financials are based on the most recent Mortgage that was taken out on this home.
Original Mortgage
$87,000
Interest Rate
6.92%
Mortgage Type
Purchase Money Mortgage
Create a Home Valuation Report for This Property
The Home Valuation Report is an in-depth analysis detailing your home's value as well as a comparison with similar homes in the area
Home Values in the Area
Average Home Value in this Area
Purchase History
| Date | Buyer | Sale Price | Title Company |
|---|---|---|---|
| Mateo-Bell Fatima M | $175,000 | -- | |
| Gomez Emilio A | $87,000 | -- |
Source: Public Records
Mortgage History
| Date | Status | Borrower | Loan Amount |
|---|---|---|---|
| Open | Mateo-Bell Fatima M | $35,000 | |
| Open | Mateo-Bell Fatima M | $140,000 | |
| Previous Owner | Gomez Emilio A | $112,500 | |
| Previous Owner | Gomez Emilio A | $87,000 |
Source: Public Records
Tax History Compared to Growth
Tax History
| Year | Tax Paid | Tax Assessment Tax Assessment Total Assessment is a certain percentage of the fair market value that is determined by local assessors to be the total taxable value of land and additions on the property. | Land | Improvement |
|---|---|---|---|---|
| 2025 | $3,420 | $388,600 | $119,100 | $269,500 |
| 2024 | $3,262 | $352,600 | $115,200 | $237,400 |
| 2023 | $3,178 | $312,800 | $99,300 | $213,500 |
| 2022 | $2,992 | $261,500 | $92,100 | $169,400 |
| 2021 | $2,888 | $235,400 | $92,100 | $143,300 |
| 2020 | $2,700 | $217,200 | $73,900 | $143,300 |
| 2019 | $2,869 | $209,700 | $76,400 | $133,300 |
| 2018 | $2,724 | $190,200 | $69,500 | $120,700 |
| 2017 | $2,571 | $167,600 | $68,800 | $98,800 |
| 2016 | $2,344 | $151,100 | $45,800 | $105,300 |
| 2015 | $2,285 | $151,100 | $45,800 | $105,300 |
Source: Public Records
Map
Nearby Homes
- 80 Ferry St Unit 80A
- 52 Howard St
- 19-21 Pleasant Terrace
- 7 Stevens Ct
- 262 E Haverhill St Unit 4
- 106 Leroy Ave
- 68 Wesley St
- 6 Brook St
- 1 Riverview Blvd Unit 2-203
- 1 Riverview Blvd Unit 3-8
- 167 Ferry 53 Mann St Unit 2,5,6
- 42 Union St
- 65 Brook St
- 35 Kendall St
- 192 Union St
- 32 Orchard St
- 115 Merrimack Rd
- 89 Newbury St Unit 89B
- 4 Shawsheen Rd Unit 2
- 62 Brightwood Ave
- 7 Allston St
- 7 Sherman St Unit 7
- 6 Ferry St
- 5 Sherman St
- 5 Sherman St
- 9 Sherman St Unit 11
- 9 Sherman St
- 130 Marston St
- 8 Ferry St Unit 20
- 8 Ferry St Unit 18
- 128 Marston St Unit 2
- 128 Marston St Unit 4
- 128 Marston St Unit 5
- 128 Marston St
- 8 Allston St
- 6 Allston St
- 4 Allston St
- 15 Allston St
- 2 Allston St
- 13 Sherman St