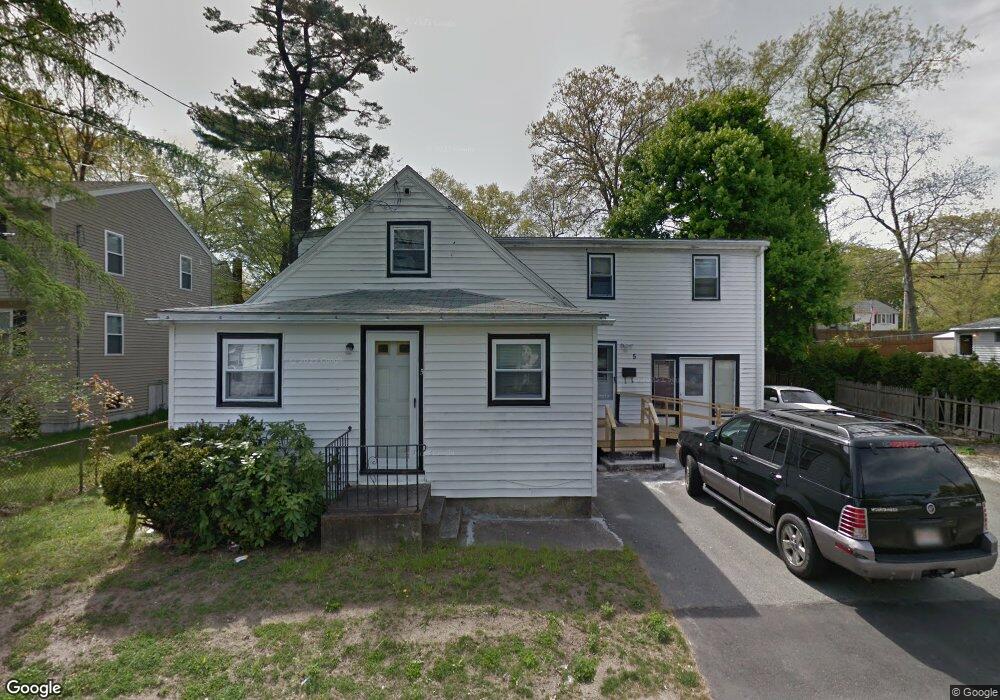
5 Amelian Rd Randolph, MA 02368
North Randolph NeighborhoodEstimated Value: $681,000 - $840,000
4
Beds
2
Baths
2,308
Sq Ft
$339/Sq Ft
Est. Value
About This Home
This home is located at 5 Amelian Rd, Randolph, MA 02368 and is currently estimated at $782,342, approximately $338 per square foot. 5 Amelian Rd is a home located in Norfolk County with nearby schools including Randolph High School and Thayer Academy.
Ownership History
Date
Name
Owned For
Owner Type
Purchase Details
Closed on
May 11, 2016
Sold by
Dahn Musu S
Bought by
Bank New York Mellon T
Current Estimated Value
Purchase Details
Closed on
Nov 1, 1994
Sold by
Adams James R and Adams Margaret N
Bought by
Dahn Musu S
Create a Home Valuation Report for This Property
The Home Valuation Report is an in-depth analysis detailing your home's value as well as a comparison with similar homes in the area
Home Values in the Area
Average Home Value in this Area
Purchase History
| Date | Buyer | Sale Price | Title Company |
|---|---|---|---|
| Bank New York Mellon T | $274,251 | -- | |
| Dahn Musu S | $127,000 | -- |
Source: Public Records
Mortgage History
| Date | Status | Borrower | Loan Amount |
|---|---|---|---|
| Previous Owner | Dahn Musu S | $46,750 | |
| Previous Owner | Dahn Musu S | $36,600 | |
| Previous Owner | Dahn Musu S | $12,000 | |
| Previous Owner | Dahn Musu S | $124,890 |
Source: Public Records
Tax History Compared to Growth
Tax History
| Year | Tax Paid | Tax Assessment Tax Assessment Total Assessment is a certain percentage of the fair market value that is determined by local assessors to be the total taxable value of land and additions on the property. | Land | Improvement |
|---|---|---|---|---|
| 2025 | $8,129 | $700,200 | $248,300 | $451,900 |
| 2024 | $6,739 | $588,600 | $243,400 | $345,200 |
| 2023 | $6,429 | $532,200 | $221,300 | $310,900 |
| 2022 | $6,287 | $462,300 | $184,400 | $277,900 |
| 2021 | $6,044 | $408,900 | $153,700 | $255,200 |
| 2020 | $5,881 | $394,400 | $153,700 | $240,700 |
| 2019 | $5,631 | $375,900 | $146,400 | $229,500 |
| 2018 | $5,433 | $342,100 | $133,000 | $209,100 |
| 2017 | $5,433 | $335,800 | $126,700 | $209,100 |
| 2016 | $5,125 | $294,700 | $115,100 | $179,600 |
| 2015 | $4,883 | $269,800 | $109,600 | $160,200 |
Source: Public Records
Map
Nearby Homes
- 11 Rockefeller St
- 9 Royal Crest Dr Unit 12
- 11 Royal Crest Dr Unit 5
- 23 Emeline St
- 1277 N Main St
- 12 Webster St
- 7 Webster St
- 26 Knights Crescent St
- 304 High St
- 172 Russ St
- 10 Michael Rd
- 33 Michael Rd
- 1 Clark Cir
- 34 Orchard St
- 229 Chestnut St
- 232 Canton St Unit 104
- 232 Canton St Unit 112
- 2 Smith Rd
- 16 Simmonds Blvd Unit 16
- 20 Simmonds Blvd Unit 20