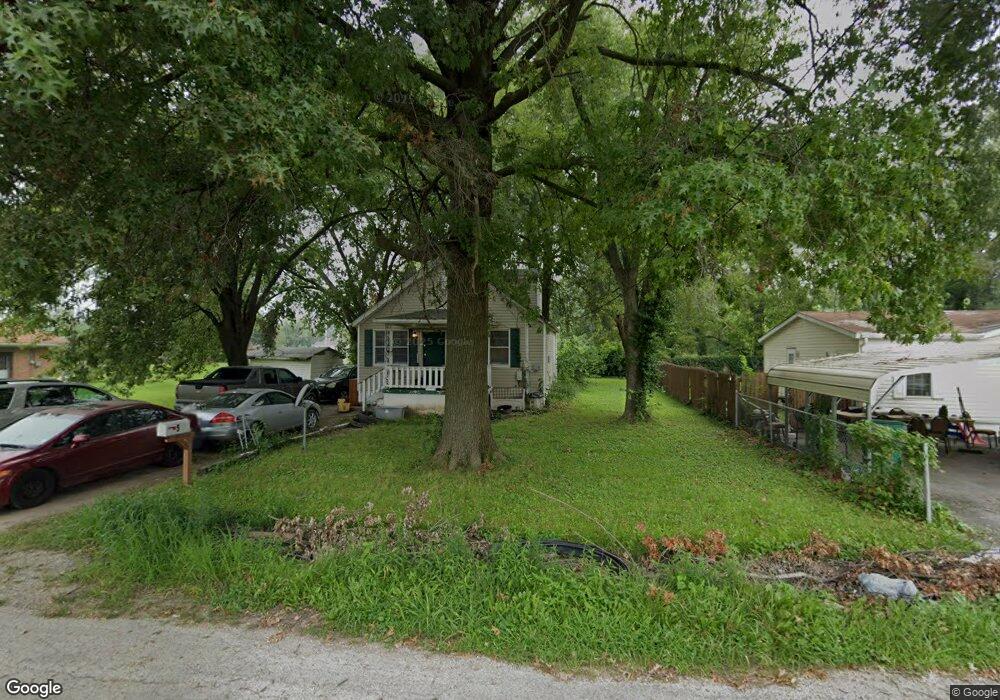
5 Ann St East Saint Louis, IL 62207
Estimated Value: $27,000 - $68,000
--
Bed
--
Bath
696
Sq Ft
$72/Sq Ft
Est. Value
About This Home
This home is located at 5 Ann St, East Saint Louis, IL 62207 and is currently estimated at $50,038, approximately $71 per square foot. 5 Ann St is a home located in St. Clair County.
Ownership History
Date
Name
Owned For
Owner Type
Purchase Details
Closed on
May 14, 2024
Sold by
Falcon Ltd
Bought by
Straub Daryl
Current Estimated Value
Purchase Details
Closed on
May 5, 2017
Sold by
Hermon Ashely
Bought by
Falcon Ltd
Purchase Details
Closed on
Mar 17, 2014
Sold by
Raven Securites Inc
Bought by
Falcon Ltd
Purchase Details
Closed on
Feb 20, 2014
Sold by
County Of St Clair
Bought by
Raven Securities Inc
Purchase Details
Closed on
Apr 6, 2004
Sold by
Us Bank Na
Bought by
L V Thomas & Jim Hayes Properties Inc
Purchase Details
Closed on
Aug 28, 2003
Sold by
Lowery
Bought by
Us Bank Na and Csfb Abs Trust Series 2001-He17
Purchase Details
Closed on
Jan 25, 2001
Sold by
Lowery Edgar and Lowery Patricia
Bought by
Lowery Edgar
Home Financials for this Owner
Home Financials are based on the most recent Mortgage that was taken out on this home.
Original Mortgage
$25,000
Interest Rate
11%
Create a Home Valuation Report for This Property
The Home Valuation Report is an in-depth analysis detailing your home's value as well as a comparison with similar homes in the area
Home Values in the Area
Average Home Value in this Area
Purchase History
| Date | Buyer | Sale Price | Title Company |
|---|---|---|---|
| Straub Daryl | -- | None Available | |
| Falcon Ltd | -- | None Available | |
| Falcon Ltd | $10,500 | None Available | |
| Raven Securities Inc | -- | None Available | |
| L V Thomas & Jim Hayes Properties Inc | $11,000 | First American Title Insuran | |
| Us Bank Na | -- | -- | |
| Lowery Edgar | -- | -- | |
| Lowery Edgar | $18,000 | -- |
Source: Public Records
Mortgage History
| Date | Status | Borrower | Loan Amount |
|---|---|---|---|
| Previous Owner | Lowery Edgar | $25,000 |
Source: Public Records
Tax History Compared to Growth
Tax History
| Year | Tax Paid | Tax Assessment Tax Assessment Total Assessment is a certain percentage of the fair market value that is determined by local assessors to be the total taxable value of land and additions on the property. | Land | Improvement |
|---|---|---|---|---|
| 2024 | $739 | $6,122 | $664 | $5,458 |
| 2023 | $738 | $5,533 | $600 | $4,933 |
| 2022 | $768 | $4,849 | $526 | $4,323 |
| 2021 | $845 | $4,594 | $498 | $4,096 |
| 2020 | $841 | $4,206 | $521 | $3,685 |
| 2019 | $859 | $4,206 | $521 | $3,685 |
| 2018 | $960 | $4,268 | $529 | $3,739 |
| 2017 | $1,179 | $4,166 | $517 | $3,649 |
| 2016 | $1,447 | $6,007 | $516 | $5,491 |
| 2014 | $1,163 | $5,941 | $510 | $5,431 |
| 2013 | $580 | $5,572 | $478 | $5,094 |
Source: Public Records
Map
Nearby Homes