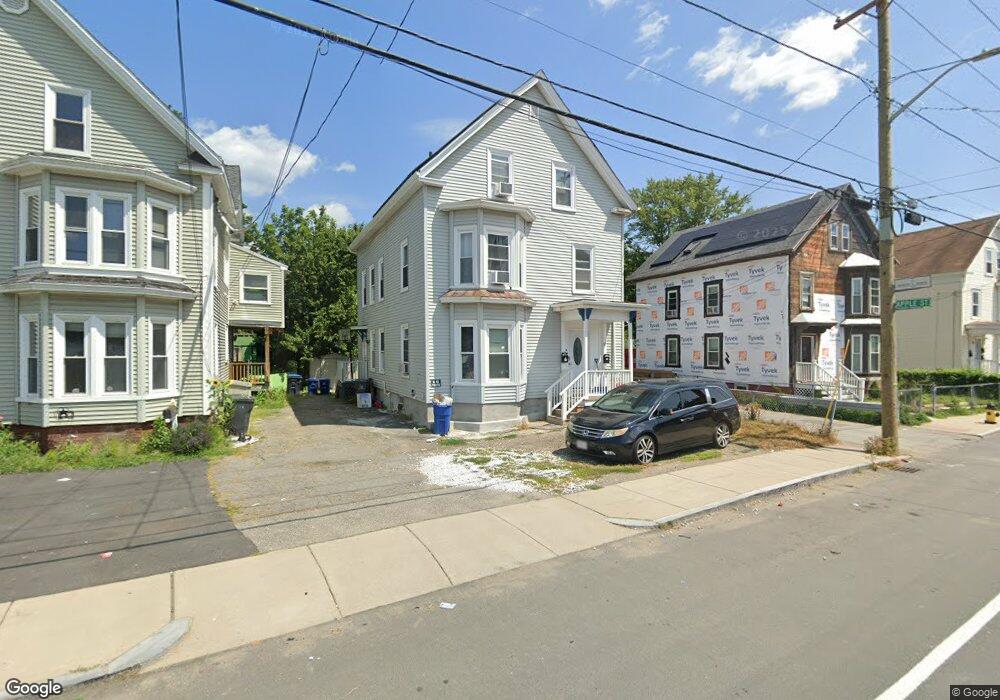
5 Apple St Haverhill, MA 01832
Broad Hill NeighborhoodEstimated Value: $383,000 - $421,000
3
Beds
1
Bath
1,155
Sq Ft
$347/Sq Ft
Est. Value
About This Home
This home is located at 5 Apple St, Haverhill, MA 01832 and is currently estimated at $401,017, approximately $347 per square foot. 5 Apple St is a home located in Essex County with nearby schools including Tilton Elementary School.
Ownership History
Date
Name
Owned For
Owner Type
Purchase Details
Closed on
Aug 20, 2001
Sold by
Sanborn Nathan T and Sanborn Michelle M
Bought by
Chetwynd Karen M and Routier John M
Current Estimated Value
Home Financials for this Owner
Home Financials are based on the most recent Mortgage that was taken out on this home.
Original Mortgage
$112,500
Interest Rate
7.16%
Mortgage Type
Purchase Money Mortgage
Purchase Details
Closed on
Oct 31, 1997
Sold by
Hills Wilbert H and Hills Charles R
Bought by
Sanborn Michelle M
Create a Home Valuation Report for This Property
The Home Valuation Report is an in-depth analysis detailing your home's value as well as a comparison with similar homes in the area
Home Values in the Area
Average Home Value in this Area
Purchase History
| Date | Buyer | Sale Price | Title Company |
|---|---|---|---|
| Chetwynd Karen M | $150,000 | -- | |
| Sanborn Michelle M | $52,000 | -- |
Source: Public Records
Mortgage History
| Date | Status | Borrower | Loan Amount |
|---|---|---|---|
| Open | Sanborn Michelle M | $15,000 | |
| Open | Sanborn Michelle M | $179,000 | |
| Closed | Sanborn Michelle M | $112,500 | |
| Previous Owner | Sanborn Michelle M | $80,000 |
Source: Public Records
Tax History Compared to Growth
Tax History
| Year | Tax Paid | Tax Assessment Tax Assessment Total Assessment is a certain percentage of the fair market value that is determined by local assessors to be the total taxable value of land and additions on the property. | Land | Improvement |
|---|---|---|---|---|
| 2025 | $4,009 | $374,300 | $136,100 | $238,200 |
| 2024 | $3,595 | $337,900 | $127,000 | $210,900 |
| 2023 | $3,554 | $318,700 | $127,000 | $191,700 |
| 2022 | $3,413 | $268,300 | $116,400 | $151,900 |
| 2021 | $3,123 | $232,400 | $99,800 | $132,600 |
| 2020 | $3,065 | $225,400 | $95,300 | $130,100 |
| 2019 | $2,976 | $213,300 | $83,200 | $130,100 |
| 2018 | $2,848 | $199,700 | $78,600 | $121,100 |
| 2017 | $2,749 | $183,400 | $72,600 | $110,800 |
| 2016 | $2,654 | $172,800 | $63,500 | $109,300 |
| 2015 | $2,652 | $172,800 | $63,500 | $109,300 |
Source: Public Records
Map
Nearby Homes
- 23 Lewis St
- 97-99 Blaisdell St Unit 2
- 99 Blaisdell St Unit C
- 11 York St Unit 11
- 9 York St Unit 9
- 5 Sherman Ave
- 5 Kimball St
- 19 Greenhill Farm Rd
- 192 Franklin St
- 151 Franklin St
- 40 Bellevue Ave Unit 42
- 6 Dexter St
- 34 7th Ave
- 25-27 Dover St
- 8 Dustin St
- 16 Standish Rd
- 17 Vine St
- 110 Pilling St
- 43 Boston St Unit 43
- 48 Portland St
- 7 Apple St
- 6 Apple St
- 4 Apple St
- 77 Hilldale Ave
- 87 Hilldale Ave
- 83 Hilldale Ave
- 3 Little River St
- 69 Hilldale Ave
- 3 1/2 Little River St
- 1 Little River St
- 5 Little River St
- 5 Little River St Unit 2
- 5 Little River St Unit 1
- 65 Hilldale Ave
- 93 Hilldale Ave
- 144 Hilldale Ave
- 95 Hilldale Ave
- 101 Hilldale Ave
- 9 Little River St
- 59 Hilldale Ave