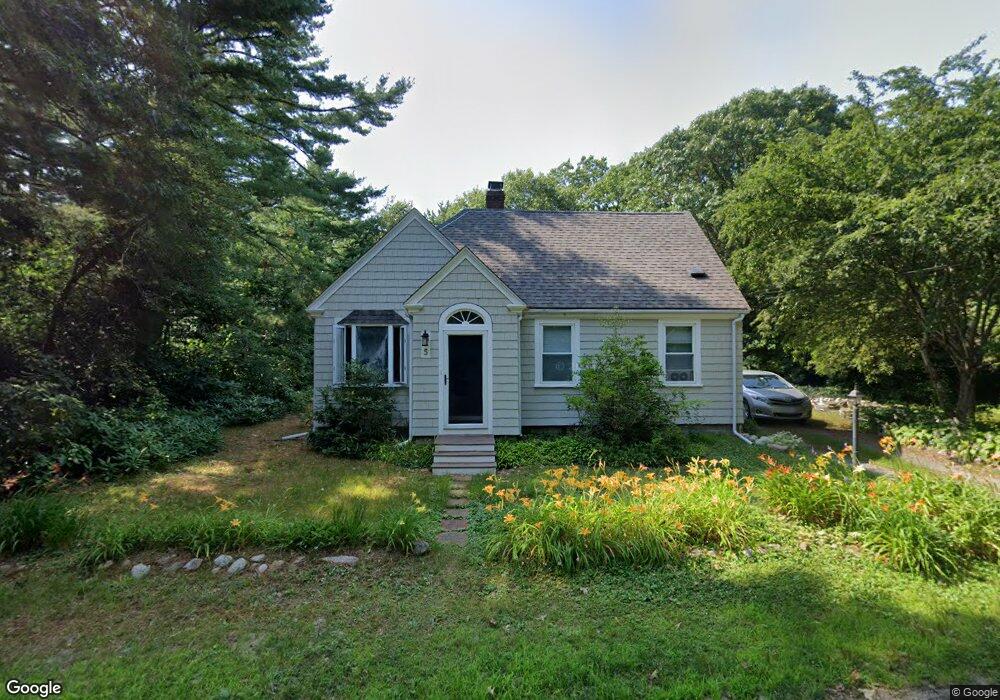
5 Arbutus Rd Buzzards Bay, MA 02532
Monument Beach NeighborhoodEstimated Value: $530,000 - $538,000
2
Beds
1
Bath
1,243
Sq Ft
$430/Sq Ft
Est. Value
About This Home
This home is located at 5 Arbutus Rd, Buzzards Bay, MA 02532 and is currently estimated at $534,737, approximately $430 per square foot. 5 Arbutus Rd is a home located in Barnstable County with nearby schools including Bourne High School, St Margaret Regional School, and Cadence Academy Preschool - Bourne.
Ownership History
Date
Name
Owned For
Owner Type
Purchase Details
Closed on
Sep 18, 2009
Sold by
Lindberg Theodore P and Lindberg Peter C
Bought by
Bergfors Robbin
Current Estimated Value
Home Financials for this Owner
Home Financials are based on the most recent Mortgage that was taken out on this home.
Original Mortgage
$211,140
Outstanding Balance
$137,593
Interest Rate
5.28%
Mortgage Type
Purchase Money Mortgage
Estimated Equity
$397,144
Create a Home Valuation Report for This Property
The Home Valuation Report is an in-depth analysis detailing your home's value as well as a comparison with similar homes in the area
Home Values in the Area
Average Home Value in this Area
Purchase History
| Date | Buyer | Sale Price | Title Company |
|---|---|---|---|
| Bergfors Robbin | $207,000 | -- | |
| Bergfors Robbin | $207,000 | -- |
Source: Public Records
Mortgage History
| Date | Status | Borrower | Loan Amount |
|---|---|---|---|
| Open | Bergfors Robbin | $211,140 | |
| Closed | Bergfors Robbin | $211,140 |
Source: Public Records
Tax History
| Year | Tax Paid | Tax Assessment Tax Assessment Total Assessment is a certain percentage of the fair market value that is determined by local assessors to be the total taxable value of land and additions on the property. | Land | Improvement |
|---|---|---|---|---|
| 2025 | $3,857 | $493,800 | $221,900 | $271,900 |
| 2024 | $3,771 | $470,200 | $211,300 | $258,900 |
| 2023 | $3,659 | $415,300 | $187,000 | $228,300 |
| 2022 | $3,462 | $343,100 | $165,500 | $177,600 |
| 2021 | $3,369 | $312,800 | $150,600 | $162,200 |
| 2020 | $3,177 | $295,800 | $149,200 | $146,600 |
| 2019 | $2,890 | $275,000 | $136,200 | $138,800 |
| 2018 | $2,764 | $262,200 | $129,700 | $132,500 |
| 2017 | $2,583 | $250,800 | $128,500 | $122,300 |
| 2016 | $2,081 | $204,800 | $128,500 | $76,300 |
| 2015 | $2,062 | $204,800 | $128,500 | $76,300 |
Source: Public Records
Map
Nearby Homes
- 203 County Rd
- 13 Laurel Hill Ct
- 566 Shore Rd
- 35 Benedict Rd
- 16 Amberwood Ct
- 12 Turnberry Rd Unit 12
- 5 Zoli Ln
- 5 Sea Knoll Ct
- 4 Harbor Hill Dr
- 4 Hollyhock Knoll Ct Unit 4
- 4 Hollyhock Knoll Ct Unit 4
- 20 Colony Ave
- 60 Bourne Neck Dr
- 44 Cotuit Rd
- 60 Sandwich Rd
- 46 Holt Rd Unit B
- 46 Holt Rd
- 10 Sandy Ln
- 14 Navajo Rd
- 38 Old Bridge Rd
Your Personal Tour Guide
Ask me questions while you tour the home.