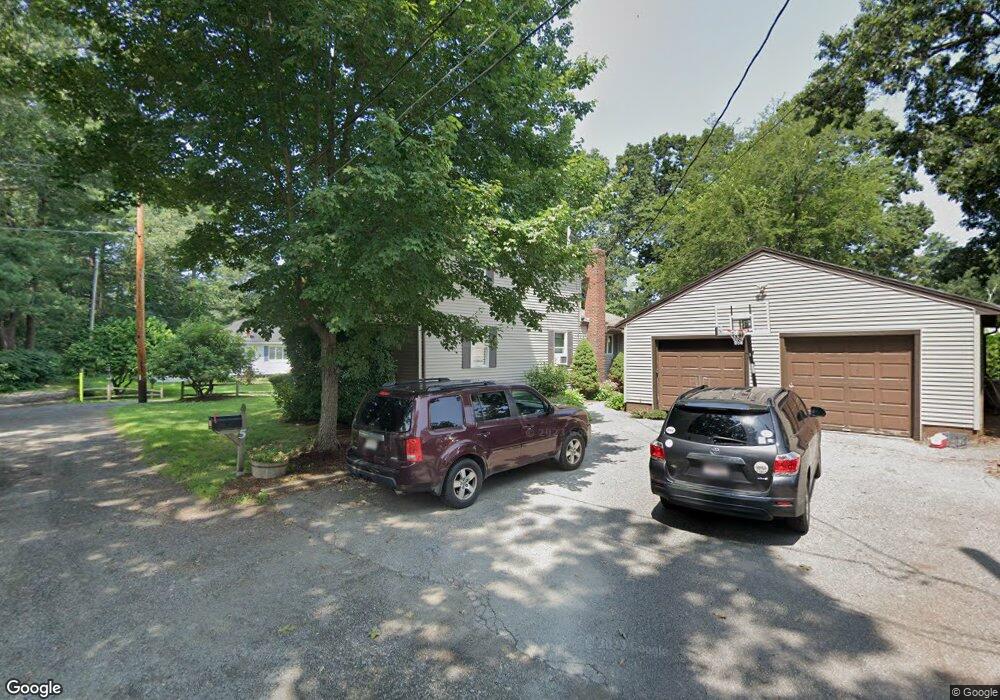
5 Arnold Rd Wilmington, MA 01887
Estimated Value: $678,069 - $733,000
3
Beds
2
Baths
1,640
Sq Ft
$431/Sq Ft
Est. Value
About This Home
This home is located at 5 Arnold Rd, Wilmington, MA 01887 and is currently estimated at $706,517, approximately $430 per square foot. 5 Arnold Rd is a home located in Middlesex County with nearby schools including Heath-Brook Elementary School and Abundant Life Christian School and Childcare.
Ownership History
Date
Name
Owned For
Owner Type
Purchase Details
Closed on
Jul 14, 2005
Sold by
Boudreau Martin J and Boudreau Monica A
Bought by
Lanagan Bill
Current Estimated Value
Home Financials for this Owner
Home Financials are based on the most recent Mortgage that was taken out on this home.
Original Mortgage
$318,320
Outstanding Balance
$164,158
Interest Rate
5.67%
Mortgage Type
Purchase Money Mortgage
Estimated Equity
$542,359
Create a Home Valuation Report for This Property
The Home Valuation Report is an in-depth analysis detailing your home's value as well as a comparison with similar homes in the area
Home Values in the Area
Average Home Value in this Area
Purchase History
| Date | Buyer | Sale Price | Title Company |
|---|---|---|---|
| Lanagan Bill | $397,900 | -- |
Source: Public Records
Mortgage History
| Date | Status | Borrower | Loan Amount |
|---|---|---|---|
| Open | Lanagan Bill | $318,320 |
Source: Public Records
Tax History Compared to Growth
Tax History
| Year | Tax Paid | Tax Assessment Tax Assessment Total Assessment is a certain percentage of the fair market value that is determined by local assessors to be the total taxable value of land and additions on the property. | Land | Improvement |
|---|---|---|---|---|
| 2025 | $6,412 | $560,000 | $232,100 | $327,900 |
| 2024 | $6,220 | $544,200 | $232,100 | $312,100 |
| 2023 | $5,952 | $498,500 | $211,000 | $287,500 |
| 2022 | $5,873 | $450,700 | $175,800 | $274,900 |
| 2021 | $5,618 | $405,900 | $159,800 | $246,100 |
| 2020 | $5,554 | $409,000 | $159,800 | $249,200 |
| 2019 | $5,350 | $389,100 | $152,200 | $236,900 |
| 2018 | $5,141 | $356,800 | $145,000 | $211,800 |
| 2017 | $4,602 | $318,500 | $138,100 | $180,400 |
| 2016 | $4,458 | $304,700 | $131,500 | $173,200 |
| 2015 | $4,277 | $297,600 | $131,500 | $166,100 |
| 2014 | $3,903 | $274,100 | $125,200 | $148,900 |
Source: Public Records
Map
Nearby Homes