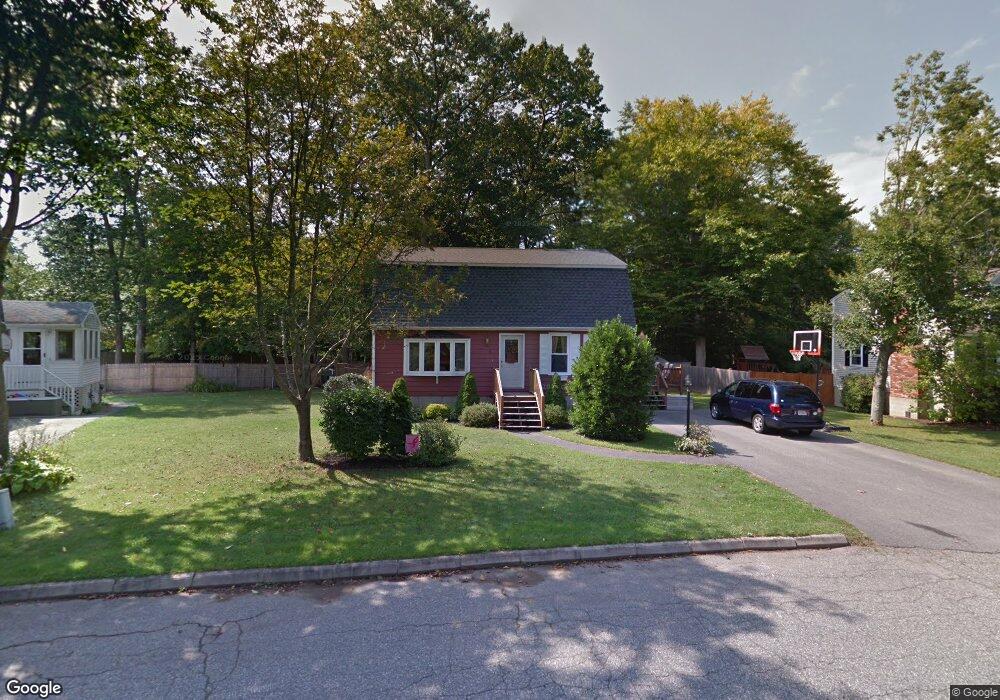
5 Ash St Amesbury, MA 01913
Estimated Value: $639,000 - $673,000
3
Beds
2
Baths
1,856
Sq Ft
$356/Sq Ft
Est. Value
About This Home
This home is located at 5 Ash St, Amesbury, MA 01913 and is currently estimated at $661,163, approximately $356 per square foot. 5 Ash St is a home located in Essex County with nearby schools including Amesbury High School and Amesbury Seventh-Day Adventist School.
Ownership History
Date
Name
Owned For
Owner Type
Purchase Details
Closed on
Apr 29, 2005
Sold by
Dewilde David M and Dewilde Ida M
Bought by
Ziomek Andrew P and Ziomek Sherri A
Current Estimated Value
Home Financials for this Owner
Home Financials are based on the most recent Mortgage that was taken out on this home.
Original Mortgage
$272,000
Outstanding Balance
$142,823
Interest Rate
5.95%
Mortgage Type
Purchase Money Mortgage
Estimated Equity
$518,340
Create a Home Valuation Report for This Property
The Home Valuation Report is an in-depth analysis detailing your home's value as well as a comparison with similar homes in the area
Home Values in the Area
Average Home Value in this Area
Purchase History
| Date | Buyer | Sale Price | Title Company |
|---|---|---|---|
| Ziomek Andrew P | $340,000 | -- |
Source: Public Records
Mortgage History
| Date | Status | Borrower | Loan Amount |
|---|---|---|---|
| Open | Ziomek Andrew P | $272,000 | |
| Closed | Ziomek Andrew P | $68,000 | |
| Previous Owner | Ziomek Andrew P | $170,000 |
Source: Public Records
Tax History
| Year | Tax Paid | Tax Assessment Tax Assessment Total Assessment is a certain percentage of the fair market value that is determined by local assessors to be the total taxable value of land and additions on the property. | Land | Improvement |
|---|---|---|---|---|
| 2025 | $8,152 | $532,800 | $236,400 | $296,400 |
| 2024 | $7,778 | $497,300 | $223,000 | $274,300 |
| 2023 | $7,103 | $434,700 | $193,900 | $240,800 |
| 2022 | $6,942 | $392,400 | $168,600 | $223,800 |
| 2021 | $6,426 | $352,100 | $135,900 | $216,200 |
| 2020 | $5,699 | $331,700 | $130,700 | $201,000 |
| 2019 | $5,810 | $316,300 | $130,700 | $185,600 |
| 2018 | $5,731 | $301,800 | $124,500 | $177,300 |
| 2017 | $5,893 | $295,400 | $124,500 | $170,900 |
| 2016 | $5,764 | $284,200 | $124,500 | $159,700 |
| 2015 | $5,673 | $276,200 | $124,500 | $151,700 |
| 2014 | $5,542 | $264,300 | $124,500 | $139,800 |
Source: Public Records
Map
Nearby Homes
- 82 Monroe St
- 3 Birchwood Point Unit 202
- 53 Rabbit Rd
- 7 Birchwood Pointe Unit 101
- 21 Congress St
- 21 River St
- 97 Elm St
- 382 Main St
- 4 Clark St
- 25 Cedar St Unit 4
- 253 Main St
- 4 Greenwood St
- 101 Market St Unit B
- 105 Market St Unit B
- 191 Elm St
- 57 Baker Rd
- 149 Market St
- 3 Tremont Ave Unit A
- 1 Hillside Ave Unit 3
- 48 Orchard St
Your Personal Tour Guide
Ask me questions while you tour the home.