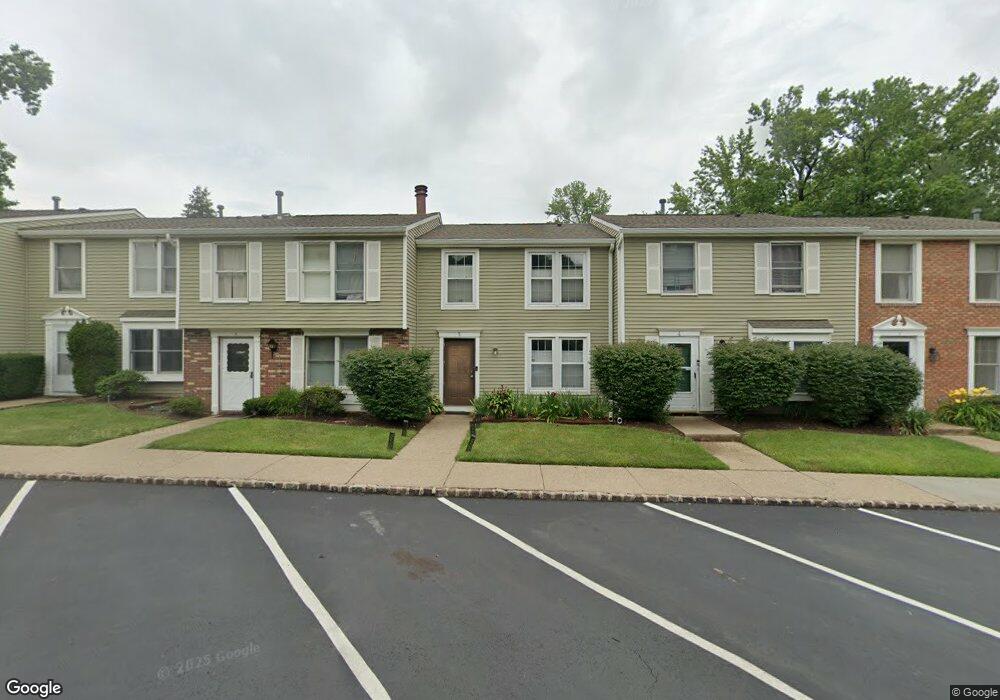
5 Aspen Ct Unit 5 Monmouth Junction, NJ 08852
Estimated Value: $342,565 - $421,000
3
Beds
3
Baths
1,600
Sq Ft
$246/Sq Ft
Est. Value
About This Home
This home is located at 5 Aspen Ct Unit 5, Monmouth Junction, NJ 08852 and is currently estimated at $393,141, approximately $245 per square foot. 5 Aspen Ct Unit 5 is a home located in Middlesex County with nearby schools including Constable Elementary School, Crossroads North Middle School, and South Brunswick High School.
Ownership History
Date
Name
Owned For
Owner Type
Purchase Details
Closed on
Oct 9, 2019
Sold by
Peavy Hagler Judia Tamika and Peavy Judia Tamika
Bought by
Hagler Mustamirr and Peavy Hagler Judia Tamika
Current Estimated Value
Purchase Details
Closed on
Jun 28, 2010
Sold by
Tortora Richard and Tortora Angela
Bought by
Peavy Judia Tamika
Home Financials for this Owner
Home Financials are based on the most recent Mortgage that was taken out on this home.
Original Mortgage
$223,506
Interest Rate
4.82%
Mortgage Type
FHA
Purchase Details
Closed on
Dec 29, 1994
Sold by
Chen Ping Chiu
Bought by
Inzano Angela
Home Financials for this Owner
Home Financials are based on the most recent Mortgage that was taken out on this home.
Original Mortgage
$35,000
Interest Rate
9.23%
Create a Home Valuation Report for This Property
The Home Valuation Report is an in-depth analysis detailing your home's value as well as a comparison with similar homes in the area
Home Values in the Area
Average Home Value in this Area
Purchase History
| Date | Buyer | Sale Price | Title Company |
|---|---|---|---|
| Hagler Mustamirr | -- | Providence Abstract Llc | |
| Peavy Judia Tamika | $227,630 | Multiple | |
| Inzano Angela | $95,000 | -- |
Source: Public Records
Mortgage History
| Date | Status | Borrower | Loan Amount |
|---|---|---|---|
| Previous Owner | Peavy Judia Tamika | $223,506 | |
| Previous Owner | Inzano Angela | $35,000 |
Source: Public Records
Tax History Compared to Growth
Tax History
| Year | Tax Paid | Tax Assessment Tax Assessment Total Assessment is a certain percentage of the fair market value that is determined by local assessors to be the total taxable value of land and additions on the property. | Land | Improvement |
|---|---|---|---|---|
| 2025 | $5,065 | $93,000 | $50,000 | $43,000 |
| 2024 | $4,883 | $93,000 | $50,000 | $43,000 |
| 2023 | $4,883 | $93,000 | $50,000 | $43,000 |
| 2022 | $4,739 | $93,000 | $50,000 | $43,000 |
| 2021 | $3,645 | $93,000 | $50,000 | $43,000 |
| 2020 | $4,765 | $93,000 | $50,000 | $43,000 |
| 2019 | $4,807 | $93,000 | $50,000 | $43,000 |
| 2018 | $4,650 | $93,000 | $50,000 | $43,000 |
| 2017 | $4,643 | $93,000 | $50,000 | $43,000 |
| 2016 | $4,593 | $93,000 | $50,000 | $43,000 |
| 2015 | $4,454 | $93,000 | $50,000 | $43,000 |
| 2014 | $4,382 | $93,000 | $50,000 | $43,000 |
Source: Public Records
Map
Nearby Homes