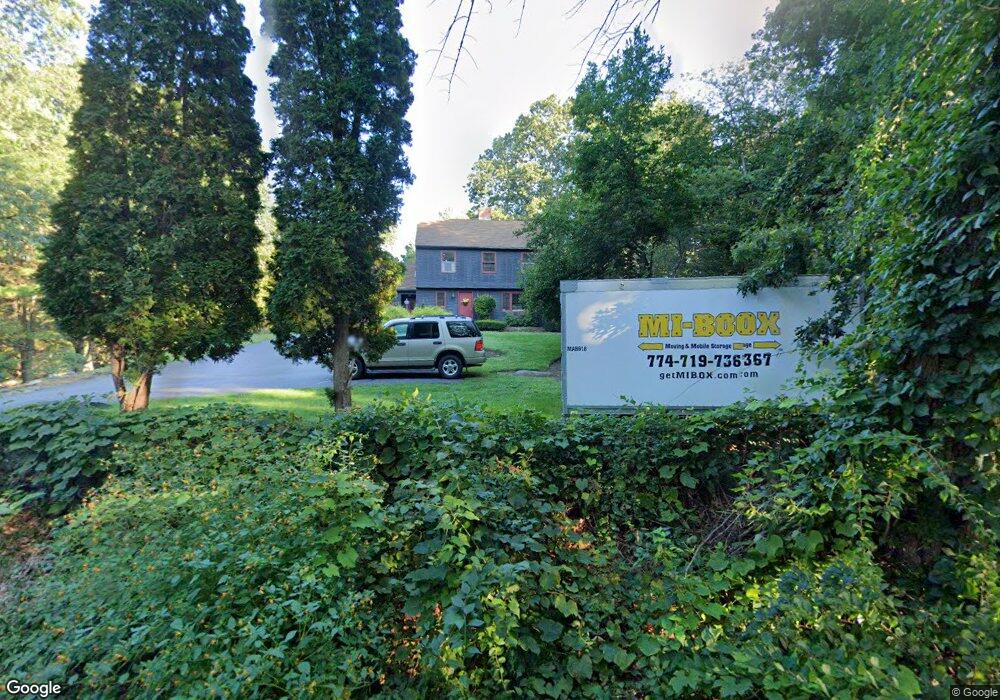
5 Asylum St Mendon, MA 01756
Estimated Value: $602,000 - $770,000
3
Beds
3
Baths
2,257
Sq Ft
$301/Sq Ft
Est. Value
About This Home
This home is located at 5 Asylum St, Mendon, MA 01756 and is currently estimated at $679,444, approximately $301 per square foot. 5 Asylum St is a home located in Worcester County with nearby schools including Nipmuc Regional High School and Our Lady of the Valley Regional School.
Ownership History
Date
Name
Owned For
Owner Type
Purchase Details
Closed on
Nov 3, 2025
Sold by
Poxon Robert J and Poxon Karen A
Bought by
Gigliello Anthony J and Gigliello Rebecca J
Current Estimated Value
Purchase Details
Closed on
Jun 16, 1978
Bought by
Poxon Robert J and Poxon Karen A
Create a Home Valuation Report for This Property
The Home Valuation Report is an in-depth analysis detailing your home's value as well as a comparison with similar homes in the area
Home Values in the Area
Average Home Value in this Area
Purchase History
| Date | Buyer | Sale Price | Title Company |
|---|---|---|---|
| Gigliello Anthony J | -- | -- | |
| Poxon Robert J | -- | -- |
Source: Public Records
Mortgage History
| Date | Status | Borrower | Loan Amount |
|---|---|---|---|
| Previous Owner | Poxon Robert J | $124,300 | |
| Previous Owner | Poxon Robert J | $124,300 | |
| Previous Owner | Poxon Robert J | $100,000 |
Source: Public Records
Tax History
| Year | Tax Paid | Tax Assessment Tax Assessment Total Assessment is a certain percentage of the fair market value that is determined by local assessors to be the total taxable value of land and additions on the property. | Land | Improvement |
|---|---|---|---|---|
| 2025 | $7,830 | $584,800 | $142,700 | $442,100 |
| 2024 | $7,761 | $566,100 | $137,200 | $428,900 |
| 2023 | $7,574 | $518,800 | $122,400 | $396,400 |
| 2022 | $7,327 | $475,500 | $119,300 | $356,200 |
| 2021 | $7,015 | $417,800 | $115,700 | $302,100 |
| 2020 | $6,608 | $394,500 | $110,000 | $284,500 |
| 2019 | $6,393 | $381,900 | $106,800 | $275,100 |
| 2018 | $6,123 | $361,000 | $101,200 | $259,800 |
| 2017 | $6,147 | $346,300 | $101,200 | $245,100 |
| 2016 | $5,917 | $343,000 | $101,400 | $241,600 |
| 2015 | $5,272 | $329,300 | $95,500 | $233,800 |
| 2014 | $5,070 | $316,500 | $92,500 | $224,000 |
Source: Public Records
Map
Nearby Homes
Your Personal Tour Guide
Ask me questions while you tour the home.