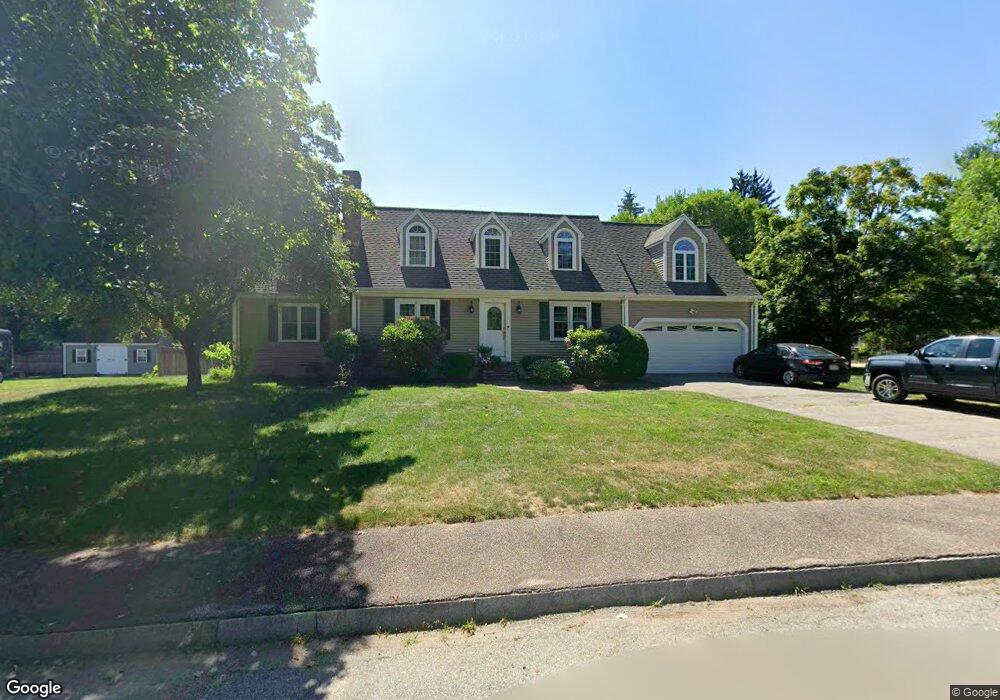
5 Atlantic Rd North Attleboro, MA 02760
North Attleboro NeighborhoodEstimated Value: $813,425 - $864,000
4
Beds
3
Baths
2,624
Sq Ft
$320/Sq Ft
Est. Value
About This Home
This home is located at 5 Atlantic Rd, North Attleboro, MA 02760 and is currently estimated at $839,856, approximately $320 per square foot. 5 Atlantic Rd is a home located in Bristol County with nearby schools including North Attleboro High School, Cadence Academy Preschool - North Attleborough, and St John The Evangelist School.
Ownership History
Date
Name
Owned For
Owner Type
Purchase Details
Closed on
Dec 16, 1992
Sold by
Fisher Stephen E and Fisher Marie D
Bought by
Brousseau Keith R and Brousseau Patricia
Current Estimated Value
Home Financials for this Owner
Home Financials are based on the most recent Mortgage that was taken out on this home.
Original Mortgage
$142,400
Interest Rate
8.3%
Mortgage Type
Purchase Money Mortgage
Create a Home Valuation Report for This Property
The Home Valuation Report is an in-depth analysis detailing your home's value as well as a comparison with similar homes in the area
Home Values in the Area
Average Home Value in this Area
Purchase History
| Date | Buyer | Sale Price | Title Company |
|---|---|---|---|
| Brousseau Keith R | $149,900 | -- |
Source: Public Records
Mortgage History
| Date | Status | Borrower | Loan Amount |
|---|---|---|---|
| Open | Brousseau Keith R | $141,000 | |
| Closed | Brousseau Keith R | $142,400 |
Source: Public Records
Tax History Compared to Growth
Tax History
| Year | Tax Paid | Tax Assessment Tax Assessment Total Assessment is a certain percentage of the fair market value that is determined by local assessors to be the total taxable value of land and additions on the property. | Land | Improvement |
|---|---|---|---|---|
| 2025 | $8,385 | $711,200 | $152,800 | $558,400 |
| 2024 | $8,019 | $694,900 | $152,800 | $542,100 |
| 2023 | $8,074 | $631,300 | $152,800 | $478,500 |
| 2022 | $7,387 | $530,300 | $152,800 | $377,500 |
| 2021 | $0 | $497,900 | $152,800 | $345,100 |
| 2020 | $0 | $481,000 | $152,800 | $328,200 |
| 2019 | $6,707 | $471,000 | $139,000 | $332,000 |
| 2018 | $5,939 | $445,200 | $139,000 | $306,200 |
| 2017 | $5,469 | $413,700 | $139,000 | $274,700 |
| 2016 | $5,437 | $411,300 | $154,500 | $256,800 |
| 2015 | $4,928 | $375,000 | $154,500 | $220,500 |
| 2014 | $4,639 | $350,400 | $135,500 | $214,900 |
Source: Public Records
Map
Nearby Homes