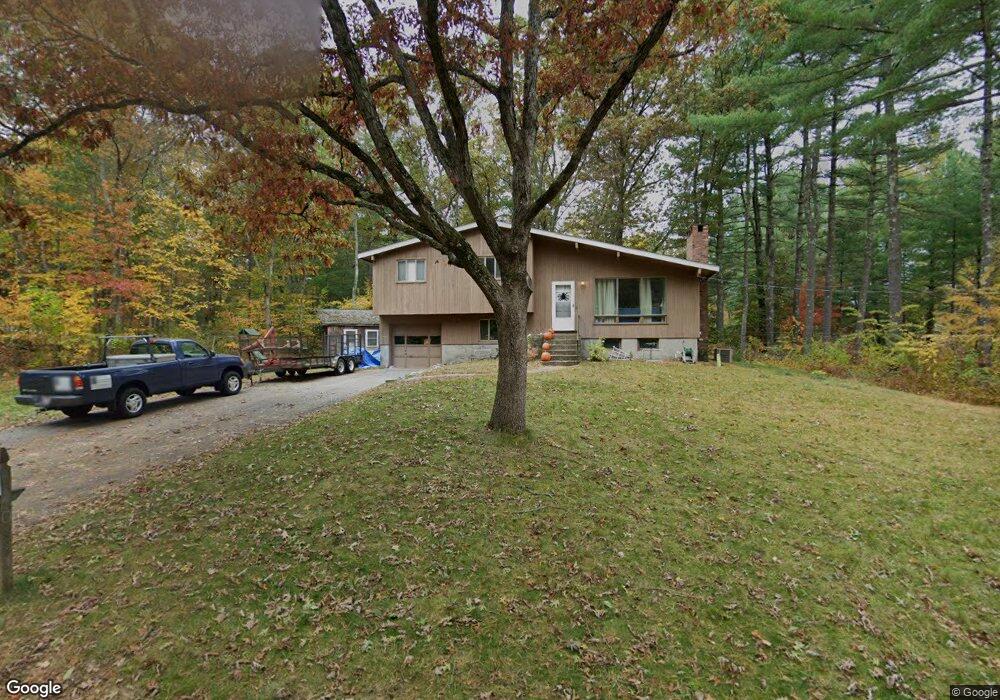
5 Austin Rd Sudbury, MA 01776
Estimated Value: $787,546 - $855,000
3
Beds
2
Baths
1,654
Sq Ft
$504/Sq Ft
Est. Value
About This Home
This home is located at 5 Austin Rd, Sudbury, MA 01776 and is currently estimated at $833,387, approximately $503 per square foot. 5 Austin Rd is a home located in Middlesex County with nearby schools including Peter Noyes Elementary School, Ephraim Curtis Middle School, and Lincoln-Sudbury Regional High School.
Ownership History
Date
Name
Owned For
Owner Type
Purchase Details
Closed on
Oct 4, 2010
Sold by
Frederic A Scott Rt and Matheson Cassandra E
Bought by
Demerle Thomas and Demerle Laura A
Current Estimated Value
Home Financials for this Owner
Home Financials are based on the most recent Mortgage that was taken out on this home.
Original Mortgage
$125,000
Outstanding Balance
$82,864
Interest Rate
4.44%
Mortgage Type
Purchase Money Mortgage
Estimated Equity
$750,523
Purchase Details
Closed on
Jun 17, 2010
Sold by
Scott Frederic A
Bought by
Frederic A Scott Rt and Scott Frederic A
Create a Home Valuation Report for This Property
The Home Valuation Report is an in-depth analysis detailing your home's value as well as a comparison with similar homes in the area
Home Values in the Area
Average Home Value in this Area
Purchase History
| Date | Buyer | Sale Price | Title Company |
|---|---|---|---|
| Demerle Thomas | $350,000 | -- | |
| Frederic A Scott Rt | -- | -- |
Source: Public Records
Mortgage History
| Date | Status | Borrower | Loan Amount |
|---|---|---|---|
| Open | Demerle Thomas | $125,000 |
Source: Public Records
Tax History
| Year | Tax Paid | Tax Assessment Tax Assessment Total Assessment is a certain percentage of the fair market value that is determined by local assessors to be the total taxable value of land and additions on the property. | Land | Improvement |
|---|---|---|---|---|
| 2025 | $10,289 | $702,800 | $418,900 | $283,900 |
| 2024 | $9,951 | $681,100 | $406,700 | $274,400 |
| 2023 | $9,902 | $627,900 | $376,500 | $251,400 |
| 2022 | $9,355 | $518,300 | $345,600 | $172,700 |
| 2021 | $9,106 | $483,600 | $345,600 | $138,000 |
| 2020 | $8,922 | $483,600 | $345,600 | $138,000 |
| 2019 | $8,661 | $483,600 | $345,600 | $138,000 |
| 2018 | $8,676 | $483,900 | $368,500 | $115,400 |
| 2017 | $8,123 | $457,900 | $350,500 | $107,400 |
| 2016 | $7,889 | $443,200 | $337,200 | $106,000 |
| 2015 | $7,431 | $422,200 | $324,200 | $98,000 |
| 2014 | $7,392 | $410,000 | $314,600 | $95,400 |
Source: Public Records
Map
Nearby Homes
- 30 Kendall Rd
- 53 Pine St
- 557 Dutton Rd Unit 2
- 30 Rolling Ln
- 15 Harness Ln
- 11 Great Lake Dr
- 62 Churchill St
- 30 Harness Ln
- 0 Robbins Rd
- 11 October Rd
- 15 Huckleberry Ln
- 0 Boston Post Rd
- 45 Webster Cir
- 22 Barracks Rd Unit 22
- 8 Twillingate Rd
- 11 Farmstead Ln Unit 11
- 173 Nobscot Rd
- 1011 Boston Post Rd
- 55 Widow Rites Ln
- 45 Widow Rites Ln
Your Personal Tour Guide
Ask me questions while you tour the home.