Estimated Value: $525,000 - $544,000
4
Beds
4
Baths
2,086
Sq Ft
$258/Sq Ft
Est. Value
About This Home
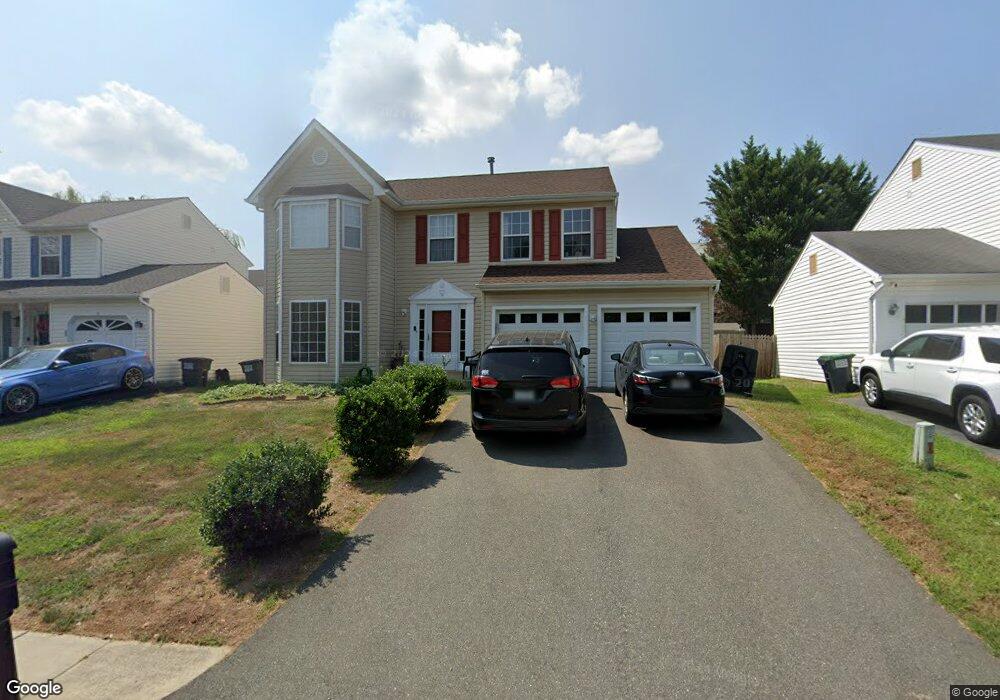
This home is located at 5 Aylor Ct, Stafford, VA 22554 and is currently estimated at $538,281, approximately $258 per square foot. 5 Aylor Ct is a home located in Stafford County with nearby schools including Park Ridge Elementary School, Rodney E. Thompson Middle School, and North Stafford High School.
Ownership History
Date
Name
Owned For
Owner Type
Purchase Details
Closed on
Feb 10, 2003
Sold by
Espinoza Armando
Bought by
Smith Joey
Current Estimated Value
Home Financials for this Owner
Home Financials are based on the most recent Mortgage that was taken out on this home.
Original Mortgage
$269,868
Outstanding Balance
$115,915
Interest Rate
5.99%
Mortgage Type
FHA
Estimated Equity
$422,366
Purchase Details
Closed on
Dec 14, 2001
Sold by
Brice Eugene F
Bought by
Espinoza Armando
Home Financials for this Owner
Home Financials are based on the most recent Mortgage that was taken out on this home.
Original Mortgage
$179,200
Interest Rate
6.6%
Purchase Details
Closed on
Jul 4, 1998
Sold by
Hour Homes Of Park Ridge
Bought by
Brice Eugene F
Home Financials for this Owner
Home Financials are based on the most recent Mortgage that was taken out on this home.
Original Mortgage
$186,350
Interest Rate
7.02%
Create a Home Valuation Report for This Property
The Home Valuation Report is an in-depth analysis detailing your home's value as well as a comparison with similar homes in the area
Home Values in the Area
Average Home Value in this Area
Purchase History
| Date | Buyer | Sale Price | Title Company |
|---|---|---|---|
| Smith Joey | $272,000 | -- | |
| Espinoza Armando | $224,000 | -- | |
| Brice Eugene F | $182,725 | -- |
Source: Public Records
Mortgage History
| Date | Status | Borrower | Loan Amount |
|---|---|---|---|
| Open | Smith Joey | $269,868 | |
| Previous Owner | Espinoza Armando | $179,200 | |
| Previous Owner | Brice Eugene F | $186,350 |
Source: Public Records
Tax History Compared to Growth
Tax History
| Year | Tax Paid | Tax Assessment Tax Assessment Total Assessment is a certain percentage of the fair market value that is determined by local assessors to be the total taxable value of land and additions on the property. | Land | Improvement |
|---|---|---|---|---|
| 2025 | $4,038 | $445,300 | $135,000 | $310,300 |
| 2024 | $4,038 | $445,300 | $135,000 | $310,300 |
| 2023 | $3,702 | $391,700 | $110,000 | $281,700 |
| 2022 | $3,329 | $391,700 | $110,000 | $281,700 |
| 2021 | $3,081 | $317,600 | $85,000 | $232,600 |
| 2020 | $3,081 | $317,600 | $85,000 | $232,600 |
| 2019 | $3,102 | $307,100 | $85,000 | $222,100 |
| 2018 | $3,040 | $307,100 | $85,000 | $222,100 |
| 2017 | $2,874 | $290,300 | $75,000 | $215,300 |
| 2016 | $2,874 | $290,300 | $75,000 | $215,300 |
| 2015 | -- | $281,100 | $75,000 | $206,100 |
| 2014 | -- | $281,100 | $75,000 | $206,100 |
Source: Public Records
Map
Nearby Homes