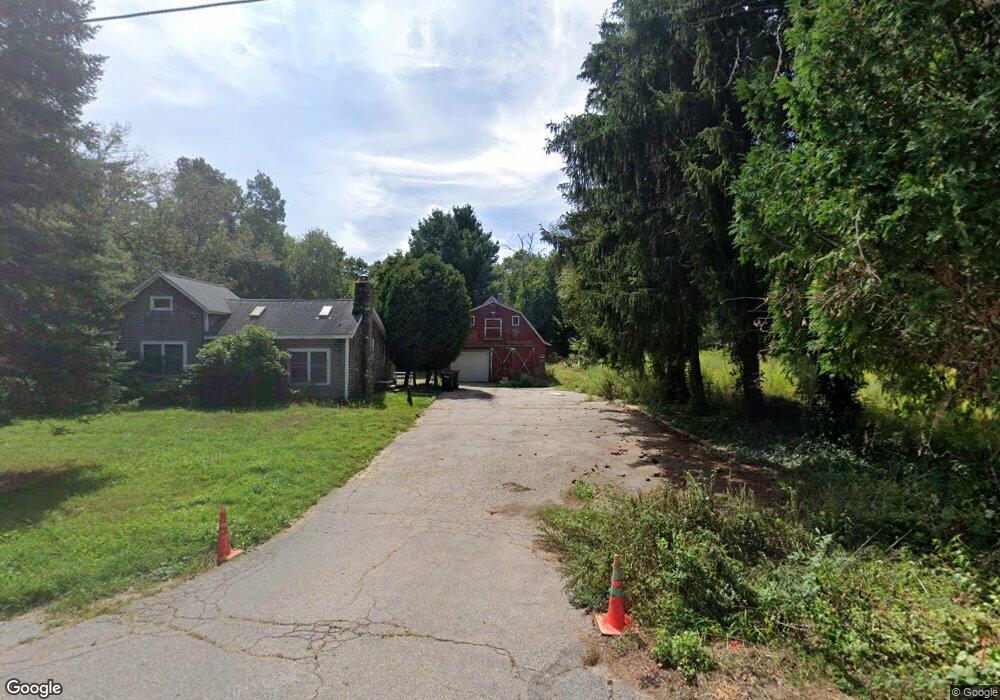
5 Baker St Rehoboth, MA 02769
Estimated Value: $527,000 - $648,000
2
Beds
1
Bath
1,349
Sq Ft
$431/Sq Ft
Est. Value
About This Home
This home is located at 5 Baker St, Rehoboth, MA 02769 and is currently estimated at $581,012, approximately $430 per square foot. 5 Baker St is a home located in Bristol County with nearby schools including Dighton-Rehoboth Regional High School.
Ownership History
Date
Name
Owned For
Owner Type
Purchase Details
Closed on
May 19, 2017
Sold by
Ferry Paul W Est and Carrelas
Bought by
Carrelas Lynn
Current Estimated Value
Home Financials for this Owner
Home Financials are based on the most recent Mortgage that was taken out on this home.
Original Mortgage
$297,000
Outstanding Balance
$246,992
Interest Rate
4.1%
Mortgage Type
New Conventional
Estimated Equity
$334,020
Purchase Details
Closed on
Nov 24, 1999
Sold by
Beardslee Ralph and Littlefield Barbara
Bought by
Ferry Paul W
Home Financials for this Owner
Home Financials are based on the most recent Mortgage that was taken out on this home.
Original Mortgage
$154,800
Interest Rate
7.77%
Mortgage Type
Purchase Money Mortgage
Create a Home Valuation Report for This Property
The Home Valuation Report is an in-depth analysis detailing your home's value as well as a comparison with similar homes in the area
Home Values in the Area
Average Home Value in this Area
Purchase History
| Date | Buyer | Sale Price | Title Company |
|---|---|---|---|
| Carrelas Lynn | -- | -- | |
| Ferry Paul W | $172,000 | -- |
Source: Public Records
Mortgage History
| Date | Status | Borrower | Loan Amount |
|---|---|---|---|
| Open | Carrelas Lynn | $297,000 | |
| Previous Owner | Ferry Paul W | $215,650 | |
| Previous Owner | Ferry Paul W | $154,800 |
Source: Public Records
Tax History
| Year | Tax Paid | Tax Assessment Tax Assessment Total Assessment is a certain percentage of the fair market value that is determined by local assessors to be the total taxable value of land and additions on the property. | Land | Improvement |
|---|---|---|---|---|
| 2025 | $46 | $415,300 | $225,500 | $189,800 |
| 2024 | $4,505 | $396,600 | $225,500 | $171,100 |
| 2023 | $4,289 | $385,500 | $221,900 | $163,600 |
| 2022 | $4,289 | $338,500 | $221,900 | $116,600 |
| 2021 | $4,336 | $327,500 | $214,100 | $113,400 |
| 2020 | $4,171 | $317,900 | $214,100 | $103,800 |
| 2018 | $3,699 | $309,000 | $206,300 | $102,700 |
| 2017 | $3,881 | $309,000 | $206,300 | $102,700 |
| 2016 | $3,754 | $309,000 | $206,300 | $102,700 |
| 2015 | $3,678 | $298,800 | $199,100 | $99,700 |
| 2014 | $3,558 | $286,000 | $191,900 | $94,100 |
Source: Public Records
Map
Nearby Homes
- 47 Spring St
- 49 Sophia Dr
- 50 Sophia Dr
- 51 Sophia Dr
- 316 High Hill Rd
- 2625 Lewis St
- 1194 Sharps Lot Rd
- 0 Hornbine Rd
- 16 Martin St
- 0B Cummings Rd
- 0A Cummings Rd
- 74R Club House Dr Unit 74R
- 73H Club House Dr Unit Lot 73H
- 35 Clubhouse Dr Unit RR35
- RR36 Club House Dr Unit Lot RR36
- RR33 Club House Dr Unit Lot RR33
- RR38 Club House Unit RR38
- RR34 Club House Dr Unit RR34
- R42 Club House Dr Unit R42
- G1 Club House Dr Unit G1
Your Personal Tour Guide
Ask me questions while you tour the home.