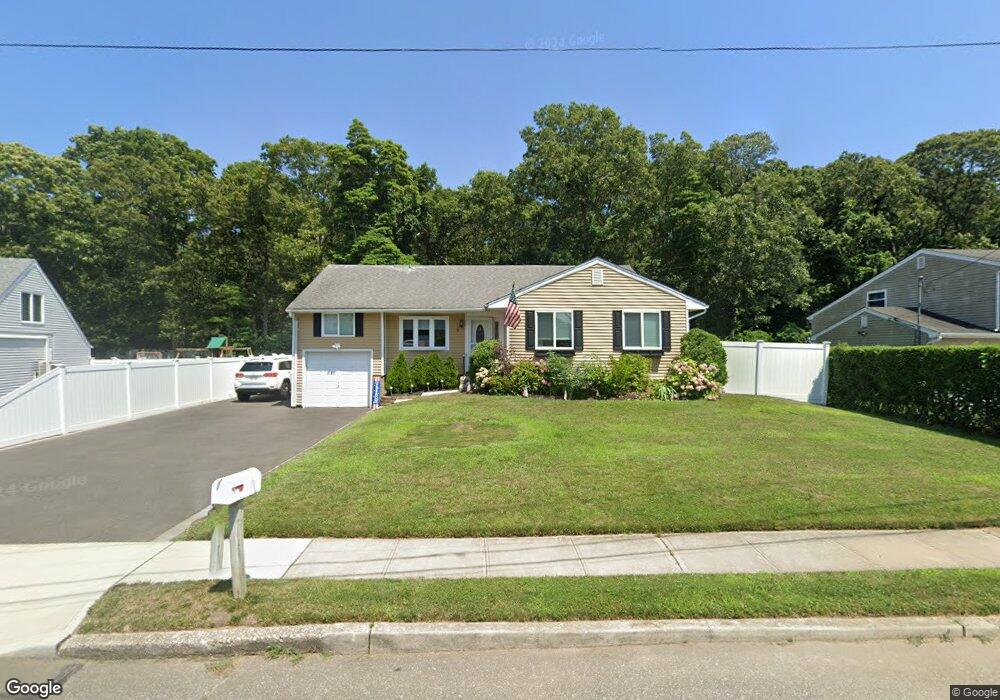
5 Bear St Selden, NY 11784
Estimated Value: $598,000 - $627,000
4
Beds
2
Baths
1,800
Sq Ft
$341/Sq Ft
Est. Value
About This Home
This home is located at 5 Bear St, Selden, NY 11784 and is currently estimated at $612,989, approximately $340 per square foot. 5 Bear St is a home located in Suffolk County.
Ownership History
Date
Name
Owned For
Owner Type
Purchase Details
Closed on
Sep 30, 2021
Sold by
Austin Derek B and Deluca Jamie M
Bought by
Kratina Thomas
Current Estimated Value
Home Financials for this Owner
Home Financials are based on the most recent Mortgage that was taken out on this home.
Original Mortgage
$437,000
Outstanding Balance
$398,965
Interest Rate
2.88%
Mortgage Type
Purchase Money Mortgage
Estimated Equity
$214,024
Purchase Details
Closed on
Mar 11, 2017
Sold by
Araujo Armando
Bought by
Deluca Jamie M and Austin Derek B
Home Financials for this Owner
Home Financials are based on the most recent Mortgage that was taken out on this home.
Original Mortgage
$282,755
Interest Rate
4.12%
Mortgage Type
New Conventional
Purchase Details
Closed on
Dec 13, 2016
Sold by
Araujo Armando
Bought by
Deluca Jamie M and Austin Derek B
Home Financials for this Owner
Home Financials are based on the most recent Mortgage that was taken out on this home.
Original Mortgage
$282,755
Interest Rate
4.12%
Mortgage Type
New Conventional
Purchase Details
Closed on
Dec 10, 2015
Sold by
Chacona Peter and Chacona Patricia
Bought by
Araujo Armando
Create a Home Valuation Report for This Property
The Home Valuation Report is an in-depth analysis detailing your home's value as well as a comparison with similar homes in the area
Home Values in the Area
Average Home Value in this Area
Purchase History
| Date | Buyer | Sale Price | Title Company |
|---|---|---|---|
| Kratina Thomas | $460,000 | None Available | |
| Deluca Jamie M | $291,500 | Fidelity National Title Insu | |
| Deluca Jamie M | $291,500 | Fidelity National Title Insu | |
| Araujo Armando | $166,000 | Pyramid Title Agency |
Source: Public Records
Mortgage History
| Date | Status | Borrower | Loan Amount |
|---|---|---|---|
| Open | Kratina Thomas | $437,000 | |
| Previous Owner | Deluca Jamie M | $282,755 | |
| Previous Owner | Deluca Jamie M | $282,755 | |
| Previous Owner | Deluca Jamie M | $152,000 | |
| Previous Owner | Deluca Jamie M | $135,000 | |
| Previous Owner | Deluca Jamie M | $113,000 |
Source: Public Records
Tax History
| Year | Tax Paid | Tax Assessment Tax Assessment Total Assessment is a certain percentage of the fair market value that is determined by local assessors to be the total taxable value of land and additions on the property. | Land | Improvement |
|---|---|---|---|---|
| 2022 | $11,361 | $2,500 | $300 | $2,200 |
| 2021 | $11,361 | $2,500 | $300 | $2,200 |
| 2020 | $10,462 | $2,500 | $300 | $2,200 |
| 2019 | $10,462 | $0 | $0 | $0 |
Source: Public Records
Map
Nearby Homes
- 20 Half Hollow Rd
- 11 Laurelton Ave
- 211 Mooney Pond Rd
- 1 Pine Ct
- 7 Maple Ct
- 78 Adirondack Dr
- 24 New Ln
- 9 Willow Ct Unit 9
- 36 Woodlawn Ave
- 8 Juniper Ct Unit 8
- 50 Laurelton Ave
- 2 Dogwood Ct Unit 2
- 5 Dogwood Ct Unit 5
- 4 Macintosh Ln
- 84 Wyona Ave
- 655 Middle Country Rd Unit 4D1
- 17 Oneida Ave
- 11 Macintosh Ln
- 172 Skyline Dr
- 199 Skyline Dr
Your Personal Tour Guide
Ask me questions while you tour the home.