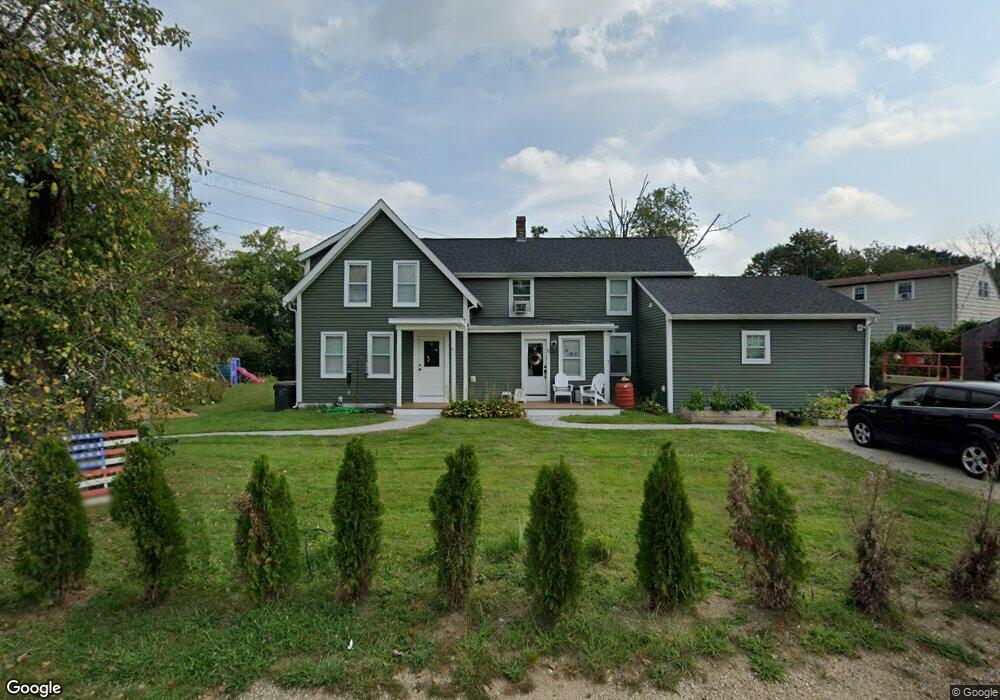
5 Beech St Bellingham, MA 02019
Estimated Value: $554,000 - $660,000
4
Beds
2
Baths
1,918
Sq Ft
$318/Sq Ft
Est. Value
About This Home
This home is located at 5 Beech St, Bellingham, MA 02019 and is currently estimated at $609,064, approximately $317 per square foot. 5 Beech St is a home located in Norfolk County with nearby schools including Stall Brook Elementary School, Bellingham High School, and Bethany Christian Academy.
Ownership History
Date
Name
Owned For
Owner Type
Purchase Details
Closed on
Jun 1, 2011
Sold by
Nicholson Thomas E Est and Otis
Bought by
Bankston Brady I
Current Estimated Value
Home Financials for this Owner
Home Financials are based on the most recent Mortgage that was taken out on this home.
Original Mortgage
$141,094
Outstanding Balance
$96,868
Interest Rate
4.85%
Mortgage Type
Purchase Money Mortgage
Estimated Equity
$512,196
Purchase Details
Closed on
Dec 8, 2010
Sold by
Nicholson Mary E and Deluca Cynthia J
Bought by
Nicholson Thomas E
Create a Home Valuation Report for This Property
The Home Valuation Report is an in-depth analysis detailing your home's value as well as a comparison with similar homes in the area
Home Values in the Area
Average Home Value in this Area
Purchase History
| Date | Buyer | Sale Price | Title Company |
|---|---|---|---|
| Bankston Brady I | $115,000 | -- | |
| Micholson Thomas E Est | -- | -- | |
| Nicholson Thomas E | -- | -- |
Source: Public Records
Mortgage History
| Date | Status | Borrower | Loan Amount |
|---|---|---|---|
| Open | Micholson Thomas E Est | $141,094 |
Source: Public Records
Tax History
| Year | Tax Paid | Tax Assessment Tax Assessment Total Assessment is a certain percentage of the fair market value that is determined by local assessors to be the total taxable value of land and additions on the property. | Land | Improvement |
|---|---|---|---|---|
| 2025 | $6,055 | $482,100 | $166,600 | $315,500 |
| 2024 | $5,714 | $444,300 | $152,100 | $292,200 |
| 2023 | $5,739 | $439,800 | $144,900 | $294,900 |
| 2022 | $5,028 | $357,100 | $120,800 | $236,300 |
| 2021 | $3,718 | $258,000 | $120,800 | $137,200 |
| 2020 | $3,444 | $242,200 | $114,800 | $127,400 |
| 2019 | $3,389 | $238,500 | $114,800 | $123,700 |
| 2018 | $3,218 | $223,300 | $110,400 | $112,900 |
| 2017 | $3,173 | $221,300 | $110,400 | $110,900 |
| 2016 | $2,668 | $186,700 | $108,500 | $78,200 |
| 2015 | $2,692 | $188,900 | $109,800 | $79,100 |
| 2014 | $2,722 | $185,700 | $107,300 | $78,400 |
Source: Public Records
Map
Nearby Homes
- 9 Beech St
- 486 Hartford Ave
- 46 Beech St
- 490 Hartford Ave
- 8 Beech St
- 10 Beech St
- 489 Hartford Ave
- 7 Stone St
- 7 Stone St Unit 7
- 491 Hartford Ave
- 12 Beech St
- 473 Hartford Ave
- 479 Hartford Ave
- 11 Stone St
- 470 Hartford Ave
- 5 West St
- 471 Hartford Ave
- 485 Hartford Ave Unit 487
- 468 Hartford Ave
- 3 West St Unit 1
Your Personal Tour Guide
Ask me questions while you tour the home.