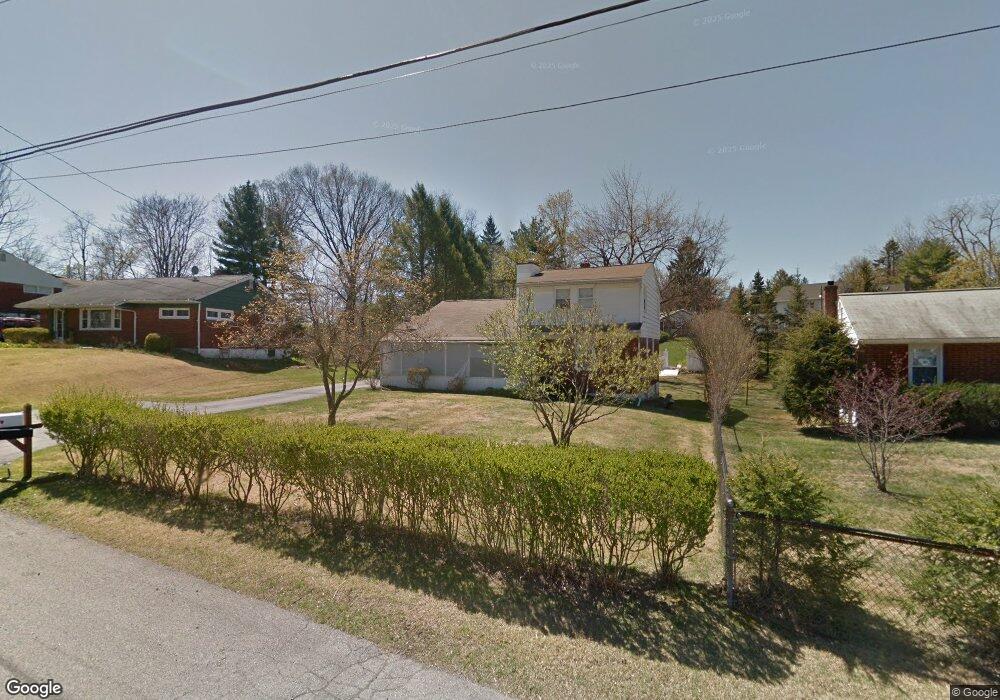
5 Beekman Ln Poughkeepsie, NY 12603
Estimated Value: $458,000 - $474,000
4
Beds
2
Baths
1,881
Sq Ft
$247/Sq Ft
Est. Value
About This Home
This home is located at 5 Beekman Ln, Poughkeepsie, NY 12603 and is currently estimated at $465,351, approximately $247 per square foot. 5 Beekman Ln is a home located in Dutchess County with nearby schools including Spackenkill High School, Poughkeepsie Day School, and St. Martin De Porres School.
Ownership History
Date
Name
Owned For
Owner Type
Purchase Details
Closed on
Aug 27, 2021
Sold by
Morancy Jean S
Bought by
Morancy Jean S and Morancy Marie N
Current Estimated Value
Home Financials for this Owner
Home Financials are based on the most recent Mortgage that was taken out on this home.
Original Mortgage
$216,886
Outstanding Balance
$192,574
Interest Rate
2.7%
Mortgage Type
FHA
Estimated Equity
$272,777
Purchase Details
Closed on
Oct 13, 2017
Sold by
Nataro Mary Ann
Bought by
Morancy Jean
Home Financials for this Owner
Home Financials are based on the most recent Mortgage that was taken out on this home.
Original Mortgage
$225,834
Interest Rate
4.5%
Mortgage Type
FHA
Purchase Details
Closed on
Jun 2, 1998
Purchase Details
Closed on
May 31, 1996
Create a Home Valuation Report for This Property
The Home Valuation Report is an in-depth analysis detailing your home's value as well as a comparison with similar homes in the area
Home Values in the Area
Average Home Value in this Area
Purchase History
| Date | Buyer | Sale Price | Title Company |
|---|---|---|---|
| Morancy Jean S | -- | None Available | |
| Morancy Jean S | -- | None Available | |
| Morancy Jean | $230,000 | -- | |
| Morancy Jean | $230,000 | -- | |
| -- | -- | -- | |
| -- | -- | -- | |
| -- | -- | -- | |
| -- | -- | -- |
Source: Public Records
Mortgage History
| Date | Status | Borrower | Loan Amount |
|---|---|---|---|
| Open | Morancy Jean S | $216,886 | |
| Closed | Morancy Jean S | $216,886 | |
| Previous Owner | Morancy Jean | $225,834 |
Source: Public Records
Tax History
| Year | Tax Paid | Tax Assessment Tax Assessment Total Assessment is a certain percentage of the fair market value that is determined by local assessors to be the total taxable value of land and additions on the property. | Land | Improvement |
|---|---|---|---|---|
| 2024 | $13,177 | $377,500 | $69,000 | $308,500 |
| 2023 | $26,549 | $377,500 | $69,000 | $308,500 |
| 2022 | $25,213 | $340,000 | $62,700 | $277,300 |
| 2021 | $20,967 | $262,500 | $62,700 | $199,800 |
| 2020 | $9,563 | $245,000 | $62,700 | $182,300 |
| 2019 | $9,298 | $245,000 | $62,700 | $182,300 |
| 2018 | $10,272 | $257,000 | $62,700 | $194,300 |
| 2017 | $9,289 | $230,000 | $62,700 | $167,300 |
| 2016 | $9,259 | $230,000 | $62,700 | $167,300 |
| 2015 | -- | $234,500 | $66,000 | $168,500 |
| 2014 | -- | $234,500 | $66,000 | $168,500 |
Source: Public Records
Map
Nearby Homes
- 16 Kingwood Ln
- 15 Laffin Ln
- 45 Old Farms Rd
- 220 Wilbur Blvd
- 174 Cedar Ave
- 2343 South Rd
- 26 Antoinette Dr
- 7 Birkdale Ct
- 42 Beechwood Park
- 47 Timberline Dr
- 34 Raker Rd
- 90 Cedar Ave
- 12 Nob Hill
- 25 Robin Rd
- 1 Essex Rd
- 17 Santa Anna Dr
- 104 Sutton Park Rd
- 14 Bellmore Dr
- 2710 South Rd Unit C6
- 2710 South Rd Unit B5
Your Personal Tour Guide
Ask me questions while you tour the home.