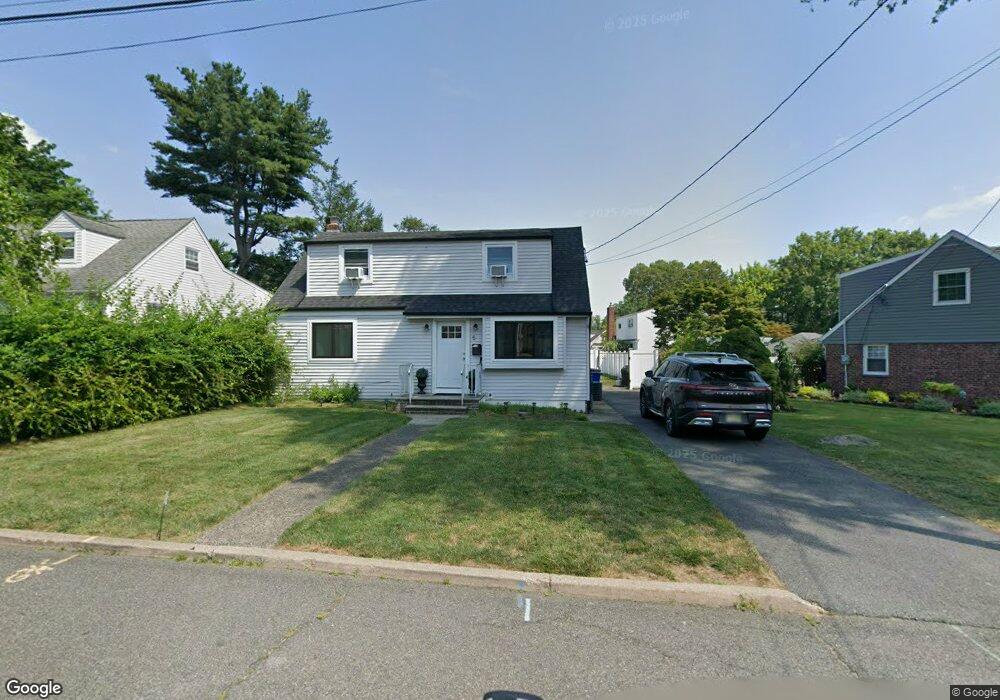
5 Bender Rd Waldwick, NJ 07463
Estimated Value: $706,117 - $799,000
3
Beds
2
Baths
1,484
Sq Ft
$507/Sq Ft
Est. Value
About This Home
This home is located at 5 Bender Rd, Waldwick, NJ 07463 and is currently estimated at $752,029, approximately $506 per square foot. 5 Bender Rd is a home located in Bergen County with nearby schools including Waldwick High School, The Village School - Montessori, and Waldwick Seventh-Day Adventist School.
Ownership History
Date
Name
Owned For
Owner Type
Purchase Details
Closed on
Sep 23, 2020
Sold by
Jj & G Llc
Bought by
Fortescue Michael S
Current Estimated Value
Home Financials for this Owner
Home Financials are based on the most recent Mortgage that was taken out on this home.
Original Mortgage
$494,700
Interest Rate
2.8%
Mortgage Type
New Conventional
Purchase Details
Closed on
May 21, 2019
Sold by
Winder Eleanor Est
Bought by
Jj & G Llc
Create a Home Valuation Report for This Property
The Home Valuation Report is an in-depth analysis detailing your home's value as well as a comparison with similar homes in the area
Home Values in the Area
Average Home Value in this Area
Purchase History
| Date | Buyer | Sale Price | Title Company |
|---|---|---|---|
| Fortescue Michael S | $510,000 | Old Republic Title | |
| Jj & G Llc | $200,000 | -- |
Source: Public Records
Mortgage History
| Date | Status | Borrower | Loan Amount |
|---|---|---|---|
| Previous Owner | Fortescue Michael S | $494,700 |
Source: Public Records
Tax History
| Year | Tax Paid | Tax Assessment Tax Assessment Total Assessment is a certain percentage of the fair market value that is determined by local assessors to be the total taxable value of land and additions on the property. | Land | Improvement |
|---|---|---|---|---|
| 2025 | $12,310 | $556,000 | $266,300 | $289,700 |
| 2024 | $13,819 | $556,000 | $266,300 | $289,700 |
| 2023 | $13,534 | $475,200 | $225,400 | $249,800 |
| 2022 | $13,534 | $475,200 | $225,400 | $249,800 |
| 2021 | $13,277 | $475,200 | $225,400 | $249,800 |
| 2020 | $9,801 | $354,200 | $225,400 | $128,800 |
| 2019 | $9,797 | $354,200 | $225,400 | $128,800 |
| 2018 | $9,489 | $354,200 | $225,400 | $128,800 |
| 2017 | $9,408 | $354,200 | $225,400 | $128,800 |
| 2016 | $9,216 | $354,200 | $225,400 | $128,800 |
| 2015 | $8,860 | $354,200 | $225,400 | $128,800 |
| 2014 | $8,640 | $354,200 | $225,400 | $128,800 |
Source: Public Records
Map
Nearby Homes
Your Personal Tour Guide
Ask me questions while you tour the home.