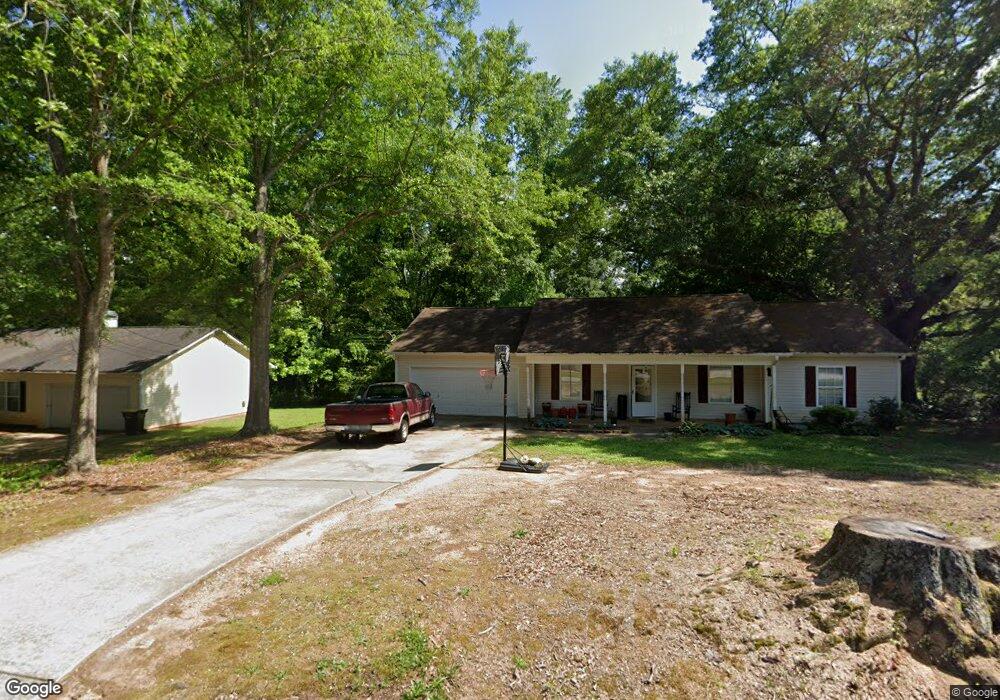
5 Bennett St Newnan, GA 30263
Estimated Value: $205,000 - $253,000
3
Beds
2
Baths
1,333
Sq Ft
$171/Sq Ft
Est. Value
About This Home
This home is located at 5 Bennett St, Newnan, GA 30263 and is currently estimated at $227,760, approximately $170 per square foot. 5 Bennett St is a home located in Coweta County with nearby schools including White Oak Elementary School, Arnall Middle School, and East Coweta High School.
Ownership History
Date
Name
Owned For
Owner Type
Purchase Details
Closed on
Jul 11, 2024
Sold by
Bender Janet M Trust
Bought by
Bender Kevin E
Current Estimated Value
Purchase Details
Closed on
Jan 30, 2023
Sold by
Bender Janet Margaret Estate
Bought by
Bender Kevin E and Bender Diane M
Purchase Details
Closed on
Mar 9, 2011
Sold by
Bender Kevin and Sells James O
Bought by
Bender Janet M
Purchase Details
Closed on
Dec 9, 2010
Sold by
Aurora Ln Svcs Llc
Bought by
Bender Kevin and Sells James
Purchase Details
Closed on
Oct 5, 2010
Sold by
Harris Felicia
Bought by
Aurora Ln Svcs Llc
Purchase Details
Closed on
Jan 12, 2007
Sold by
Meagher William A and Meagher Barbara A
Bought by
Harris Felicia
Home Financials for this Owner
Home Financials are based on the most recent Mortgage that was taken out on this home.
Original Mortgage
$101,500
Interest Rate
6.06%
Mortgage Type
New Conventional
Purchase Details
Closed on
Mar 28, 2002
Sold by
Willingham Eugene
Bought by
Hyde Properties Inc
Create a Home Valuation Report for This Property
The Home Valuation Report is an in-depth analysis detailing your home's value as well as a comparison with similar homes in the area
Home Values in the Area
Average Home Value in this Area
Purchase History
| Date | Buyer | Sale Price | Title Company |
|---|---|---|---|
| Bender Kevin E | -- | -- | |
| Bender Kevin E | -- | -- | |
| Bender Janet M | $28,200 | -- | |
| Bender Kevin | $27,300 | -- | |
| Aurora Ln Svcs Llc | $57,900 | -- | |
| Harris Felicia | $101,500 | -- | |
| Hyde Properties Inc | $10,000 | -- |
Source: Public Records
Mortgage History
| Date | Status | Borrower | Loan Amount |
|---|---|---|---|
| Previous Owner | Harris Felicia | $101,500 |
Source: Public Records
Tax History Compared to Growth
Tax History
| Year | Tax Paid | Tax Assessment Tax Assessment Total Assessment is a certain percentage of the fair market value that is determined by local assessors to be the total taxable value of land and additions on the property. | Land | Improvement |
|---|---|---|---|---|
| 2024 | $1,677 | $73,400 | $10,000 | $63,400 |
| 2023 | $1,677 | $68,114 | $10,000 | $58,114 |
| 2022 | $1,581 | $64,986 | $10,000 | $54,986 |
| 2021 | $1,322 | $49,172 | $8,000 | $41,172 |
| 2020 | $1,351 | $49,172 | $8,000 | $41,172 |
| 2019 | $990 | $32,946 | $5,700 | $27,246 |
| 2018 | $996 | $32,946 | $5,700 | $27,246 |
| 2017 | $707 | $23,508 | $4,275 | $19,233 |
| 2016 | $708 | $23,508 | $4,275 | $19,233 |
| 2015 | $709 | $23,508 | $4,275 | $19,233 |
| 2014 | $725 | $23,508 | $4,275 | $19,233 |
Source: Public Records
Map
Nearby Homes
- 123 Chastain Cir
- 81 Chastain Cir
- 40 Wilcoxon St
- 30 Pinson St
- 21 Umber Ln Unit LOT 24
- 22 Umber Ln Unit LOT 8
- 23 Umber Ln Unit LOT 23
- 19 Umber Ln Unit LOT 25
- 17 Umber Ln Unit LOT 26
- 8 Umber Ln Unit LOT 2
- 12 Umber Ln Unit LOT 4
- 40 Umber Ln Unit LOT 14
- 6 Umber Ln Unit LOT 1
- 0 Highway 34 Unit 20149159
- 0 Davis St Unit 10606043
- Springdale Plan at The Retreat at Brown's Ridge - The Retreat at Browns Ridge
- Boxwood Plan at The Retreat at Brown's Ridge - The Retreat at Browns Ridge
- Emory Plan at The Retreat at Brown's Ridge - The Retreat at Browns Ridge
- McIntosh Plan at The Retreat at Brown's Ridge - The Retreat at Browns Ridge
- Sullivan Plan at The Retreat at Brown's Ridge - The Retreat at Browns Ridge
- 7 Bennett St
- 30 Roberts Rd
- 28 Roberts Rd
- 32 Roberts Rd
- 9 Bennett St
- 26 Roberts Rd
- 0 Bennett St Unit 3152787
- 0 Bennett St Unit 7167320
- 0 Bennett St Unit 7034565
- 0 Bennett St Unit 7025105
- 0 Bennett St
- 11 Bennett St
- 24 Roberts Rd
- 27 Roberts Rd
- 29 Roberts Rd
- 45 Roberts Rd Unit JOE
- 22 Roberts Rd
- 11 Millstream Ct
- 25 Roberts Rd
- 7 Mill Stream Ct