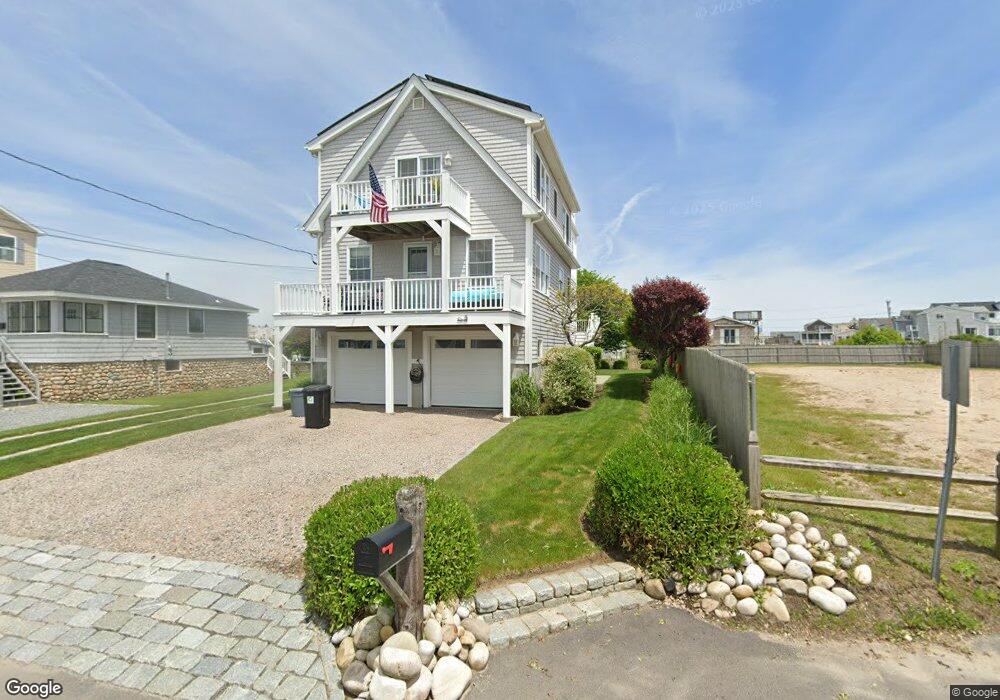
5 Benson Ave Westerly, RI 02891
Estimated Value: $1,392,000 - $1,851,432
3
Beds
3
Baths
2,100
Sq Ft
$774/Sq Ft
Est. Value
About This Home
This home is located at 5 Benson Ave, Westerly, RI 02891 and is currently estimated at $1,625,108, approximately $773 per square foot. 5 Benson Ave is a home with nearby schools including Westerly High School.
Ownership History
Date
Name
Owned For
Owner Type
Purchase Details
Closed on
May 31, 2007
Sold by
John Geragotelis Ft and Geragotelis
Bought by
Sidman Robert and Sidman Laura
Current Estimated Value
Create a Home Valuation Report for This Property
The Home Valuation Report is an in-depth analysis detailing your home's value as well as a comparison with similar homes in the area
Home Values in the Area
Average Home Value in this Area
Purchase History
We collect this data history from publicly available records. To have your information removed, we recommend requesting removal directly through your county’s website.
| Date | Buyer | Sale Price | Title Company |
|---|---|---|---|
| Sidman Robert | $385,500 | -- |
Source: Public Records
Mortgage History
We collect this data history from publicly available records. To have your information removed, we recommend requesting removal directly through your county’s website.
| Date | Status | Borrower | Loan Amount |
|---|---|---|---|
| Open | Sidman Robert | $450,000 | |
| Closed | Sidman Robert | $100,000 | |
| Closed | Sidman Robert | $54,000 |
Source: Public Records
Tax History
| Year | Tax Paid | Tax Assessment Tax Assessment Total Assessment is a certain percentage of the fair market value that is determined by local assessors to be the total taxable value of land and additions on the property. | Land | Improvement |
|---|---|---|---|---|
| 2025 | $11,223 | $1,578,500 | $1,101,900 | $476,600 |
| 2024 | $11,322 | $1,154,100 | $787,100 | $367,000 |
| 2023 | $9,638 | $1,001,900 | $688,700 | $313,200 |
| 2022 | $7,983 | $835,000 | $590,300 | $244,700 |
| 2021 | $7,126 | $618,600 | $427,900 | $190,700 |
| 2020 | $6,996 | $618,600 | $427,900 | $190,700 |
| 2019 | $6,928 | $618,600 | $427,900 | $190,700 |
| 2018 | $6,747 | $567,900 | $389,000 | $178,900 |
| 2017 | $6,582 | $567,900 | $389,000 | $178,900 |
| 2016 | $6,633 | $567,900 | $389,000 | $178,900 |
| 2015 | $6,300 | $582,300 | $396,900 | $185,400 |
| 2014 | $6,196 | $582,300 | $396,900 | $185,400 |
Source: Public Records
Map
Nearby Homes
- 27 Benson Ave
- 115 Atlantic Ave
- 12 Montauk Ave
- 16 Rabbit Run
- 26 Windward Dr
- 13 No Bottom Ridge Rd
- 6 S Essex Dr
- 1 Compass Way Unit A103
- 8 Kettle Close
- 18 No Bottom Ridge Ridge
- 50 Ocean View Hwy
- 4 Quail Run
- 6 Fox Run Run
- 20 Browning Rd
- 111 Avondale Rd
- 399 Atlantic Ave
- 43 Avondale Rd
- 408 Atlantic Ave
- 60 Avondale Rd
- 419 Atlantic Ave
Your Personal Tour Guide
Ask me questions while you tour the home.