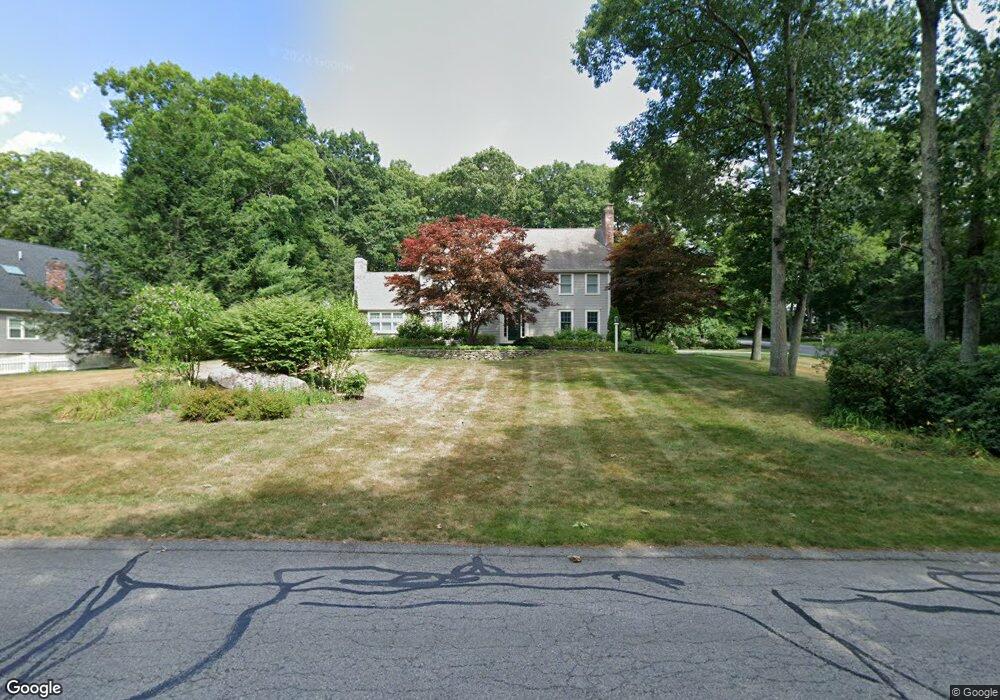
5 Benson Rd Hopkinton, MA 01748
Estimated Value: $1,337,781 - $1,796,000
4
Beds
4
Baths
4,056
Sq Ft
$372/Sq Ft
Est. Value
About This Home
This home is located at 5 Benson Rd, Hopkinton, MA 01748 and is currently estimated at $1,507,195, approximately $371 per square foot. 5 Benson Rd is a home located in Middlesex County with nearby schools including Marathon Elementary School, Hopkins Elementary School, and Elmwood Elementary School.
Ownership History
Date
Name
Owned For
Owner Type
Purchase Details
Closed on
Feb 3, 2022
Sold by
Joseph Catherine A
Bought by
Catherine A Joseph Ret
Current Estimated Value
Purchase Details
Closed on
Jun 26, 2006
Sold by
Joseph Catherine A and Joseph George T
Bought by
Joseph Catherine A
Purchase Details
Closed on
May 10, 1995
Sold by
Deborde Robert S and Deborde Barbara J
Bought by
Joseph Ii George T and Joseph Catherine A
Create a Home Valuation Report for This Property
The Home Valuation Report is an in-depth analysis detailing your home's value as well as a comparison with similar homes in the area
Home Values in the Area
Average Home Value in this Area
Purchase History
| Date | Buyer | Sale Price | Title Company |
|---|---|---|---|
| Catherine A Joseph Ret | -- | None Available | |
| Joseph Catherine A | -- | -- | |
| Joseph Ii George T | $366,000 | -- |
Source: Public Records
Mortgage History
| Date | Status | Borrower | Loan Amount |
|---|---|---|---|
| Previous Owner | Joseph Ii George T | $300,000 | |
| Previous Owner | Joseph Ii George T | $198,000 | |
| Previous Owner | Joseph Ii George T | $200,000 |
Source: Public Records
Tax History Compared to Growth
Tax History
| Year | Tax Paid | Tax Assessment Tax Assessment Total Assessment is a certain percentage of the fair market value that is determined by local assessors to be the total taxable value of land and additions on the property. | Land | Improvement |
|---|---|---|---|---|
| 2025 | $15,378 | $1,084,500 | $417,500 | $667,000 |
| 2024 | $15,148 | $1,036,800 | $397,400 | $639,400 |
| 2023 | $13,794 | $872,500 | $326,400 | $546,100 |
| 2022 | $13,568 | $796,700 | $296,800 | $499,900 |
| 2021 | $13,187 | $772,100 | $288,100 | $484,000 |
| 2020 | $12,637 | $751,300 | $281,100 | $470,200 |
| 2019 | $12,344 | $718,900 | $275,900 | $443,000 |
| 2018 | $11,634 | $688,400 | $262,800 | $425,600 |
| 2017 | $11,327 | $674,200 | $255,200 | $419,000 |
| 2016 | $11,189 | $657,000 | $250,200 | $406,800 |
| 2015 | $11,175 | $622,200 | $242,800 | $379,400 |
Source: Public Records
Map
Nearby Homes
- 11 Kimball Rd
- 10 Oak St
- 20 Davenport Ln Unit 20
- 7 Davenport Ln Unit 7
- 2 Emerald Dr
- 180 Ash St
- 5 Myrtle Ave Unit 2
- 7 Myrtle Ave Unit 3
- 13 Fitch Ave
- 13 Fitch Ave Unit 19
- 16 Fitch Ave Unit 6
- 11 Fitch Ave Unit 18
- 14 Fitch Ave Unit 7
- 283 Hayden Rowe St
- 52 S Mill St
- 12 Fitch Ave Unit 8
- 10 Fitch Ave Unit 9
- 15 Chamberlain St
- Stockbridge Plan at Newbury Glen
- Williamstown Plan at Newbury Glen