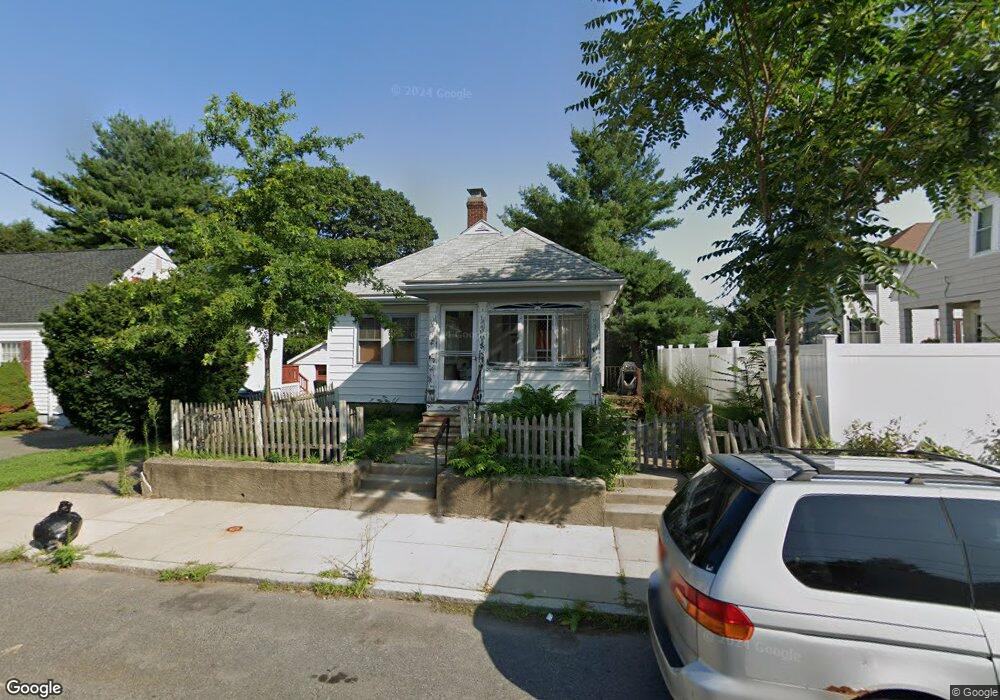
5 Berwick St West Roxbury, MA 02132
West Roxbury NeighborhoodEstimated Value: $583,000 - $948,000
2
Beds
2
Baths
974
Sq Ft
$735/Sq Ft
Est. Value
About This Home
This home is located at 5 Berwick St, West Roxbury, MA 02132 and is currently estimated at $715,457, approximately $734 per square foot. 5 Berwick St is a home located in Suffolk County with nearby schools including St Theresa School, Catholic Memorial School, and The Roxbury Latin School.
Ownership History
Date
Name
Owned For
Owner Type
Purchase Details
Closed on
Sep 12, 1991
Sold by
Labelle Alan L and Labelle Mary A
Bought by
Savage Paul
Current Estimated Value
Home Financials for this Owner
Home Financials are based on the most recent Mortgage that was taken out on this home.
Original Mortgage
$119,000
Interest Rate
9.34%
Mortgage Type
Purchase Money Mortgage
Create a Home Valuation Report for This Property
The Home Valuation Report is an in-depth analysis detailing your home's value as well as a comparison with similar homes in the area
Home Values in the Area
Average Home Value in this Area
Purchase History
| Date | Buyer | Sale Price | Title Company |
|---|---|---|---|
| Savage Paul | $149,000 | -- |
Source: Public Records
Mortgage History
| Date | Status | Borrower | Loan Amount |
|---|---|---|---|
| Closed | Savage Paul | $119,000 | |
| Previous Owner | Savage Paul | $45,000 | |
| Previous Owner | Savage Paul | $20,000 |
Source: Public Records
Tax History
| Year | Tax Paid | Tax Assessment Tax Assessment Total Assessment is a certain percentage of the fair market value that is determined by local assessors to be the total taxable value of land and additions on the property. | Land | Improvement |
|---|---|---|---|---|
| 2025 | $6,459 | $557,800 | $181,100 | $376,700 |
| 2024 | $5,687 | $521,700 | $194,500 | $327,200 |
| 2023 | $5,336 | $496,800 | $185,200 | $311,600 |
| 2022 | $4,914 | $451,700 | $168,400 | $283,300 |
| 2021 | $4,550 | $426,400 | $165,100 | $261,300 |
| 2020 | $4,360 | $412,900 | $149,800 | $263,100 |
| 2019 | $4,144 | $393,200 | $127,300 | $265,900 |
| 2018 | $3,816 | $364,100 | $127,300 | $236,800 |
| 2017 | $3,779 | $356,800 | $127,300 | $229,500 |
| 2016 | $3,810 | $346,400 | $127,300 | $219,100 |
| 2015 | $3,904 | $322,400 | $149,500 | $172,900 |
| 2014 | $3,826 | $304,100 | $149,500 | $154,600 |
Source: Public Records
Map
Nearby Homes
- 340 Baker St Unit 2
- 183 Temple St
- 1216 Vfw Pkwy Unit 40
- 68 Carroll St
- 76 Lasell St
- 73 Dent St Unit 2
- 17-31 Charles Park Rd Unit 196
- 23 Atlantis St
- 116 Spring St Unit D2
- 15 Cass St Unit 3
- 17 Cass St Unit 4
- 425 Lagrange St Unit 203
- 348 Lagrange St
- 37 Hastings St Unit 201
- 50 Trimount St
- 17 Hastings St Unit 5
- 2231 Centre St
- 923 Lagrange St
- 71 Joyce Kilmer Rd
- 25 Cavanaugh Path
- 9 Berwick St
- 404 Baker St
- 408 Baker St
- 408 Baker St Unit 2
- 408 Baker St Unit 1
- 8 Cotuit St
- 12 Cotuit St
- 11 Berwick St
- 412 Baker St
- 412 Baker St Unit 2
- 412 Baker St Unit 1
- 20 Cotuit St
- 382 Baker St
- 382 Baker St Unit 1
- 8 Berwick St
- 24 Cotuit St
- 416 Baker St
- 416 Baker St
- 416 Baker St Unit 2
- 10 Berwick St
Your Personal Tour Guide
Ask me questions while you tour the home.