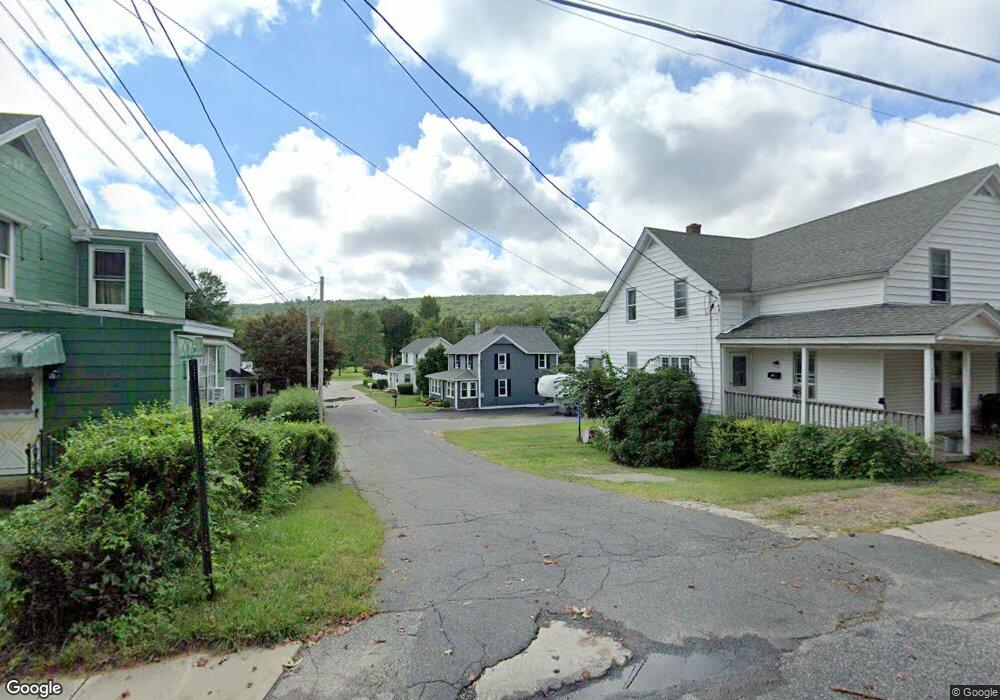
5 Bourneside St Three Rivers, MA 01080
Estimated Value: $311,029 - $358,000
3
Beds
2
Baths
1,296
Sq Ft
$257/Sq Ft
Est. Value
About This Home
This home is located at 5 Bourneside St, Three Rivers, MA 01080 and is currently estimated at $333,257, approximately $257 per square foot. 5 Bourneside St is a home located in Hampden County with nearby schools including Old Mill Pond Elementary School, Palmer High School, and Converse Middle School.
Ownership History
Date
Name
Owned For
Owner Type
Purchase Details
Closed on
Jun 17, 2013
Sold by
Boulrice Michael J and Scharrett Lisa A
Bought by
Boulrice Michael J
Current Estimated Value
Home Financials for this Owner
Home Financials are based on the most recent Mortgage that was taken out on this home.
Original Mortgage
$142,500
Outstanding Balance
$98,822
Interest Rate
3.39%
Mortgage Type
New Conventional
Estimated Equity
$234,435
Purchase Details
Closed on
May 1, 2007
Sold by
Izyk Ronald M
Bought by
Boulrice Michael J and Scharrett Lisa A
Purchase Details
Closed on
May 19, 2000
Sold by
Poitras Lynn C Est
Bought by
Izyk Ronald M
Create a Home Valuation Report for This Property
The Home Valuation Report is an in-depth analysis detailing your home's value as well as a comparison with similar homes in the area
Home Values in the Area
Average Home Value in this Area
Purchase History
We collect this data history from publicly available records. To have your information removed, we recommend requesting removal directly through your county’s website.
| Date | Buyer | Sale Price | Title Company |
|---|---|---|---|
| Boulrice Michael J | -- | -- | |
| Boulrice Michael J | -- | -- | |
| Boulrice Michael J | -- | -- | |
| Boulrice Michael J | $150,000 | -- | |
| Boulrice Michael J | $150,000 | -- | |
| Izyk Ronald M | $115,000 | -- | |
| Izyk Ronald M | $115,000 | -- |
Source: Public Records
Mortgage History
We collect this data history from publicly available records. To have your information removed, we recommend requesting removal directly through your county’s website.
| Date | Status | Borrower | Loan Amount |
|---|---|---|---|
| Open | Boulrice Michael J | $142,500 | |
| Closed | Izyk Ronald M | $142,500 | |
| Previous Owner | Izyk Ronald M | $151,056 |
Source: Public Records
Tax History
| Year | Tax Paid | Tax Assessment Tax Assessment Total Assessment is a certain percentage of the fair market value that is determined by local assessors to be the total taxable value of land and additions on the property. | Land | Improvement |
|---|---|---|---|---|
| 2025 | $5,591 | $306,700 | $57,900 | $248,800 |
| 2024 | $5,188 | $275,100 | $52,600 | $222,500 |
| 2023 | $5,038 | $255,500 | $52,600 | $202,900 |
| 2022 | $5,036 | $230,800 | $46,200 | $184,600 |
| 2021 | $4,465 | $191,800 | $51,200 | $140,600 |
| 2020 | $4,319 | $184,400 | $51,200 | $133,200 |
| 2019 | $4,223 | $184,400 | $51,200 | $133,200 |
| 2018 | $4,108 | $179,300 | $49,700 | $129,600 |
| 2017 | $3,989 | $179,300 | $49,700 | $129,600 |
| 2016 | $3,870 | $174,400 | $48,300 | $126,100 |
| 2015 | $3,723 | $174,400 | $48,300 | $126,100 |
Source: Public Records
Map
Nearby Homes
- 25 Bourne St
- 63 Charles St
- 22 Quaboag Valley Co-Op Unit 22
- 54-57 Breton and Calkins Rd
- 42 Mechanic St
- 4018-4024 Church St
- 99 Longview St
- 3012 Thorndike St
- 4030-4032 Pine St
- 3055 Pine St
- 44-50 Lawrence St
- 62-91 Lawrence St
- 70 Summer St
- 48 Longview St
- 7,37,38 Thorndike and Lawrence St
- 0 St Unit 73414881
- 4013-A-D Pine St
- Lot 14 Center St
- 2B Forest Hill Dr
- 45 River St
- 11 Bourneside St
- 45 Bourne St Unit 47
- 41 Bourne St
- 6 Bourneside St
- 39 Bourne St
- 51 Bourne St
- 53 Bourne St
- 57 Bourne St
- 30 Bourne St
- 30 Bourne St Unit 1
- 38 Bourne St
- 61 Bourne St
- 29 Bourne St
- 2095 Main St Unit 2097
- 2107 Main St Unit 2109
- 65 Bourne St
- 2107-2109 Main St
- 2113 Main St
- 42 Bourne St Unit 52
- 69 Bourne St
Your Personal Tour Guide
Ask me questions while you tour the home.