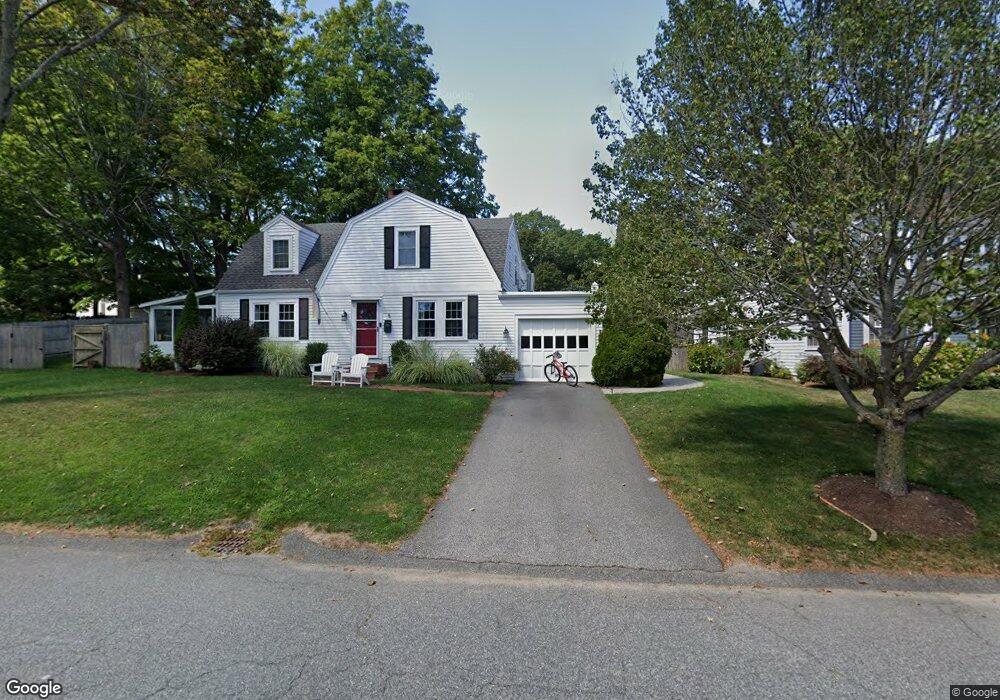
5 Bradley Park Dr Hingham, MA 02043
Estimated Value: $1,075,000 - $1,695,000
3
Beds
2
Baths
1,772
Sq Ft
$780/Sq Ft
Est. Value
About This Home
This home is located at 5 Bradley Park Dr, Hingham, MA 02043 and is currently estimated at $1,381,333, approximately $779 per square foot. 5 Bradley Park Dr is a home located in Plymouth County with nearby schools including William L. Foster Elementary School, Hingham Middle School, and Hingham High School.
Ownership History
Date
Name
Owned For
Owner Type
Purchase Details
Closed on
Mar 31, 2011
Sold by
Gabriel Jonathan H and Gabriel Frances T
Bought by
Lambert Michael J and Lambert Laura A
Current Estimated Value
Home Financials for this Owner
Home Financials are based on the most recent Mortgage that was taken out on this home.
Original Mortgage
$528,987
Outstanding Balance
$356,111
Interest Rate
4.75%
Mortgage Type
FHA
Estimated Equity
$1,025,222
Purchase Details
Closed on
Jun 30, 2005
Sold by
Eikinas Todd and Eikinas Ingrid
Bought by
Gabriel Jonathan H and Gabriel Frances T
Purchase Details
Closed on
Jun 30, 2004
Sold by
Kennedy Christopher G and Kennedy Ellen M
Bought by
Eikinas Todd and Eikinas Ingrid
Purchase Details
Closed on
Dec 11, 1998
Sold by
Caplain Judd A and Caplain Kathryn K
Bought by
Kennedy Christopher G and Kennedy Ellen M
Purchase Details
Closed on
Sep 4, 1990
Sold by
Williams Stuart C
Bought by
Caplain Judd A
Create a Home Valuation Report for This Property
The Home Valuation Report is an in-depth analysis detailing your home's value as well as a comparison with similar homes in the area
Purchase History
| Date | Buyer | Sale Price | Title Company |
|---|---|---|---|
| Lambert Michael J | $560,000 | -- | |
| Gabriel Jonathan H | $580,000 | -- | |
| Eikinas Todd | $545,000 | -- | |
| Kennedy Christopher G | $250,000 | -- | |
| Caplain Judd A | $201,000 | -- |
Source: Public Records
Mortgage History
| Date | Status | Borrower | Loan Amount |
|---|---|---|---|
| Open | Lambert Michael J | $528,987 | |
| Previous Owner | Caplain Judd A | $260,000 | |
| Previous Owner | Caplain Judd A | $67,000 |
Source: Public Records
Tax History
| Year | Tax Paid | Tax Assessment Tax Assessment Total Assessment is a certain percentage of the fair market value that is determined by local assessors to be the total taxable value of land and additions on the property. | Land | Improvement |
|---|---|---|---|---|
| 2025 | $12,280 | $1,148,700 | $547,300 | $601,400 |
| 2024 | $11,887 | $1,095,600 | $547,300 | $548,300 |
| 2023 | $10,455 | $1,045,500 | $547,300 | $498,200 |
| 2022 | $10,131 | $876,400 | $456,100 | $420,300 |
| 2021 | $10,134 | $858,800 | $475,100 | $383,700 |
| 2020 | $4,915 | $858,800 | $475,100 | $383,700 |
| 2019 | $9,316 | $788,800 | $475,100 | $313,700 |
| 2018 | $8,139 | $691,500 | $475,100 | $216,400 |
| 2017 | $7,785 | $635,500 | $455,000 | $180,500 |
| 2016 | $7,003 | $560,700 | $346,700 | $214,000 |
| 2015 | $6,819 | $544,200 | $330,200 | $214,000 |
Source: Public Records
Map
Nearby Homes
- 43 Park View Dr
- 225 South St Unit 1
- 1 Squirrel Hill Ln
- 6 Adams Ct
- 21 Hersey St
- 34 Otis Hill Rd
- 151 Stayner Dr Unit 151
- 132 Hms Stayner Dr Unit 132
- 19 Lantern Ln
- 12 Daley Rd
- 1206 Tuckers Ln Unit 1206
- 7 Lewis Ct
- 16 Foley Beach Rd
- 17 Paige St
- 26 Bel Air Rd
- 81 Kimball Beach Rd
- 130 Broad Reach Unit 206
- 51 Broad Reach Unit T23A
- 156 Fort Hill St
- 64 Broad Reach Unit 107
- 3 Bradley Park Dr
- 7 Bradley Park Dr
- 6 Park View Dr
- 4 Park View Dr
- 1 Bradley Park Dr
- 10 Park View Dr
- 11 Bradley Park Dr
- 14 Bradley Park Dr
- 7 Park View Dr
- 16 Bradley Park Dr
- 4 Bradley Park Dr
- 9 Park View Dr
- 13 Bradley Park Dr
- 12 Park View Dr
- 3 Park View Dr
- 18 Bradley Park Dr
- 11 Park View Dr
- 15 Bradley Park Dr
- 1 Harborview Dr
- 3 Harborview Dr
Your Personal Tour Guide
Ask me questions while you tour the home.