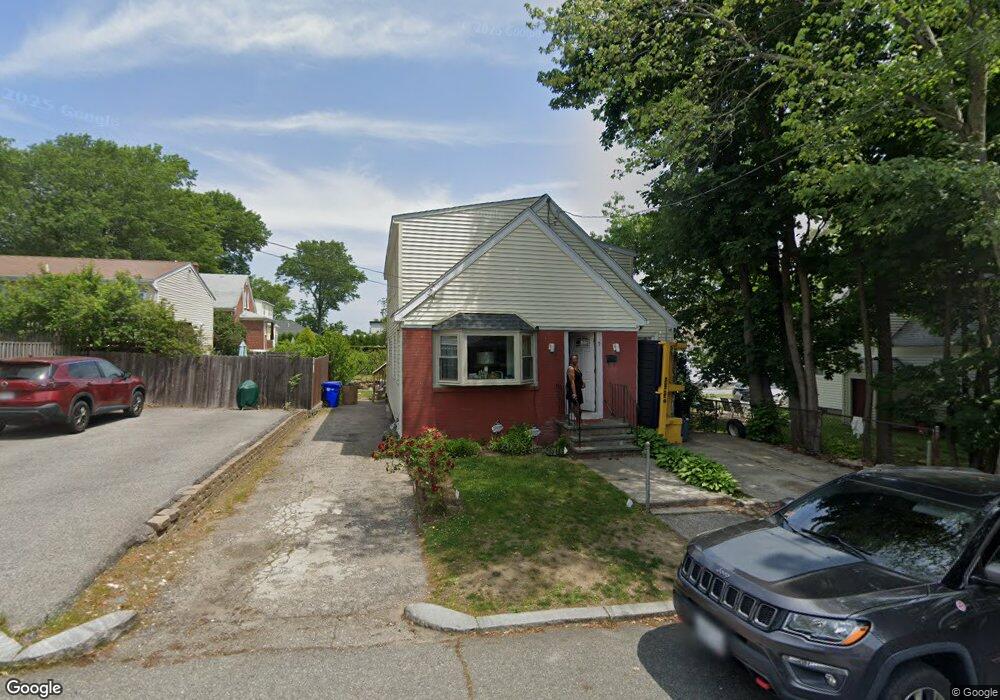
5 Bradley St Providence, RI 02908
Elmhurst NeighborhoodEstimated Value: $354,000 - $480,000
3
Beds
1
Bath
612
Sq Ft
$688/Sq Ft
Est. Value
About This Home
This home is located at 5 Bradley St, Providence, RI 02908 and is currently estimated at $421,262, approximately $688 per square foot. 5 Bradley St is a home located in Providence County with nearby schools including St. Pius V Catholic School, St. Augustine School, and The San Miguel School.
Ownership History
Date
Name
Owned For
Owner Type
Purchase Details
Closed on
Aug 7, 1998
Sold by
Ryder Nancy J
Bought by
Ranglin Carol T
Current Estimated Value
Home Financials for this Owner
Home Financials are based on the most recent Mortgage that was taken out on this home.
Original Mortgage
$56,000
Interest Rate
6.92%
Create a Home Valuation Report for This Property
The Home Valuation Report is an in-depth analysis detailing your home's value as well as a comparison with similar homes in the area
Home Values in the Area
Average Home Value in this Area
Purchase History
| Date | Buyer | Sale Price | Title Company |
|---|---|---|---|
| Ranglin Carol T | $70,000 | -- |
Source: Public Records
Mortgage History
| Date | Status | Borrower | Loan Amount |
|---|---|---|---|
| Open | Ranglin Carol T | $113,850 | |
| Closed | Ranglin Carol T | $111,500 | |
| Closed | Ranglin Carol T | $56,000 |
Source: Public Records
Tax History
| Year | Tax Paid | Tax Assessment Tax Assessment Total Assessment is a certain percentage of the fair market value that is determined by local assessors to be the total taxable value of land and additions on the property. | Land | Improvement |
|---|---|---|---|---|
| 2025 | $3,415 | $406,600 | $158,400 | $248,200 |
| 2024 | $5,846 | $318,600 | $103,000 | $215,600 |
| 2023 | $5,846 | $318,600 | $103,000 | $215,600 |
| 2022 | $5,671 | $318,600 | $103,000 | $215,600 |
| 2021 | $5,592 | $227,700 | $78,400 | $149,300 |
| 2020 | $5,592 | $227,700 | $78,400 | $149,300 |
| 2019 | $5,592 | $227,700 | $78,400 | $149,300 |
| 2018 | $5,309 | $166,100 | $63,100 | $103,000 |
| 2017 | $5,309 | $166,100 | $63,100 | $103,000 |
| 2016 | $5,309 | $166,100 | $63,100 | $103,000 |
| 2015 | $4,591 | $138,700 | $63,100 | $75,600 |
| 2014 | $4,681 | $138,700 | $63,100 | $75,600 |
| 2013 | $4,681 | $138,700 | $63,100 | $75,600 |
Source: Public Records
Map
Nearby Homes
- 556 Admiral St
- 36 Hereford St
- 39 Hillview Ave
- 0 Wainwright St
- 160 Cumberland St
- 73 Wainwright St
- 179 Devonshire St
- 835 River Ave
- 466 Admiral St
- 507 Sharon St
- 876 Douglas Ave
- 354 Jastram St
- 36 Walton St
- 65 Veazie St
- 29 Stansbury St
- 25 Hymer St
- 871 Douglas Ave
- 873 Douglas Ave
- 272 Veazie St
- 30 Oneil St
Your Personal Tour Guide
Ask me questions while you tour the home.