Estimated Value: $237,276 - $256,000
3
Beds
2
Baths
1,248
Sq Ft
$199/Sq Ft
Est. Value
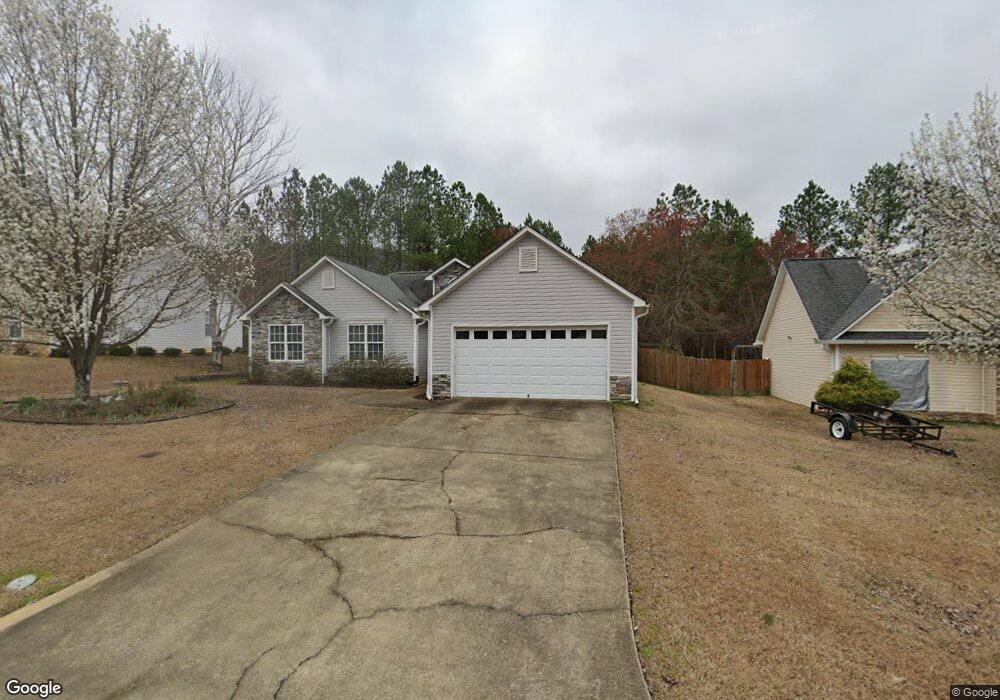
About This Home
This home is located at 5 Brandon Ln SW, Rome, GA 30165 and is currently estimated at $247,819, approximately $198 per square foot. 5 Brandon Ln SW is a home located in Floyd County with nearby schools including Coosa Middle School and Coosa High School.
Ownership History
Date
Name
Owned For
Owner Type
Purchase Details
Closed on
Jul 27, 2016
Sold by
James M
Bought by
Kidney Harry Oliver and Kidney Dawn
Current Estimated Value
Purchase Details
Closed on
Oct 16, 2008
Bought by
P and R
Home Financials for this Owner
Home Financials are based on the most recent Mortgage that was taken out on this home.
Original Mortgage
$116,741
Interest Rate
6.36%
Mortgage Type
FHA
Purchase Details
Closed on
Sep 25, 2008
Sold by
Gibson Sarah G
Bought by
Tucker James M
Home Financials for this Owner
Home Financials are based on the most recent Mortgage that was taken out on this home.
Original Mortgage
$116,741
Interest Rate
6.36%
Mortgage Type
FHA
Purchase Details
Closed on
Nov 30, 2001
Sold by
Waid Rena and Yancey Delos H
Bought by
Gibson Sarah G
Purchase Details
Closed on
Dec 21, 2000
Bought by
P and R
Purchase Details
Closed on
Jul 13, 1999
Sold by
Waid Rena
Bought by
Waid Rena and Yancey Delos H
Purchase Details
Closed on
May 13, 1999
Sold by
Brown Bernard and Rena Waid
Bought by
Waid Rena
Purchase Details
Closed on
Jun 28, 1996
Bought by
Brown Bernard and Rena Waid
Create a Home Valuation Report for This Property
The Home Valuation Report is an in-depth analysis detailing your home's value as well as a comparison with similar homes in the area
Home Values in the Area
Average Home Value in this Area
Purchase History
| Date | Buyer | Sale Price | Title Company |
|---|---|---|---|
| Kidney Harry Oliver | $117,000 | -- | |
| P | -- | -- | |
| Tucker James M | $118,900 | -- | |
| Gibson Sarah G | $103,400 | -- | |
| P | -- | -- | |
| Waid Rena | $250,000 | -- | |
| Waid Rena | $250,000 | -- | |
| Brown Bernard | -- | -- |
Source: Public Records
Mortgage History
| Date | Status | Borrower | Loan Amount |
|---|---|---|---|
| Previous Owner | Tucker James M | $116,741 |
Source: Public Records
Tax History Compared to Growth
Tax History
| Year | Tax Paid | Tax Assessment Tax Assessment Total Assessment is a certain percentage of the fair market value that is determined by local assessors to be the total taxable value of land and additions on the property. | Land | Improvement |
|---|---|---|---|---|
| 2024 | $1,055 | $73,539 | $10,500 | $63,039 |
| 2023 | $1,017 | $71,865 | $10,500 | $61,365 |
| 2022 | $819 | $58,766 | $10,000 | $48,766 |
| 2021 | $734 | $53,924 | $10,000 | $43,924 |
| 2020 | $707 | $52,147 | $10,000 | $42,147 |
| 2019 | $657 | $50,354 | $10,000 | $40,354 |
| 2018 | $507 | $42,210 | $3,744 | $38,466 |
| 2017 | $489 | $41,214 | $3,744 | $37,470 |
| 2016 | $1,250 | $39,640 | $3,720 | $35,920 |
| 2015 | $1,234 | $40,040 | $3,720 | $36,320 |
| 2014 | $1,234 | $39,978 | $3,720 | $36,258 |
Source: Public Records
Map
Nearby Homes
- 248 Smith Rd SW
- 99 Janie Beth Dr SW
- 27 Stonebrook Dr SW
- 0 Roberts Rd SW Unit 10525813
- 0 Roberts Rd SW Unit 7582010
- 2 Stonebrook Dr SW
- 37 Willowrun Dr SW
- 0 Mt Alto Rd Sw Lot Unit WP001
- 1 Willowrun Dr SW
- 22 Gowen Dr SW
- 26 Berryrun Dr SW
- 331 Leafmore Rd SW
- 52 Glenda Dr SW
- The Foxcroft Plan at North Haven
- The Benson II Plan at North Haven
- The Coleman Plan at North Haven
- The Bradley Plan at North Haven
- The McGinnis Plan at North Haven
- The Pearson Plan at North Haven
- The Caldwell Plan at North Haven
- 3 Brandon Ln SW
- 7 Brandon Ln SW
- 4 Brandon Ln
- 9 Brandon Ln SW
- 2 Brandon Ln
- 1 Brandon Ln SW
- 8 Brandon Ln SW
- 6 Brandon Ln SW
- 10 Brandon Ln SW
- 11 Brandon Ln SW
- 12 Brandon Ln SW
- 14 Brandon Ln SW
- 15 Brandon Ln SW
- 9 Bentley Ln SW
- 7 Bentley Ln SW
- 11 Bentley Ln SW
- 5 Bentley Ln SW
- 5 Bentley Ln SW
- 0 Brandon Ln SW Unit LOT 30 2765134
- 0 Brandon Ln SW Unit LOT 31 2765141