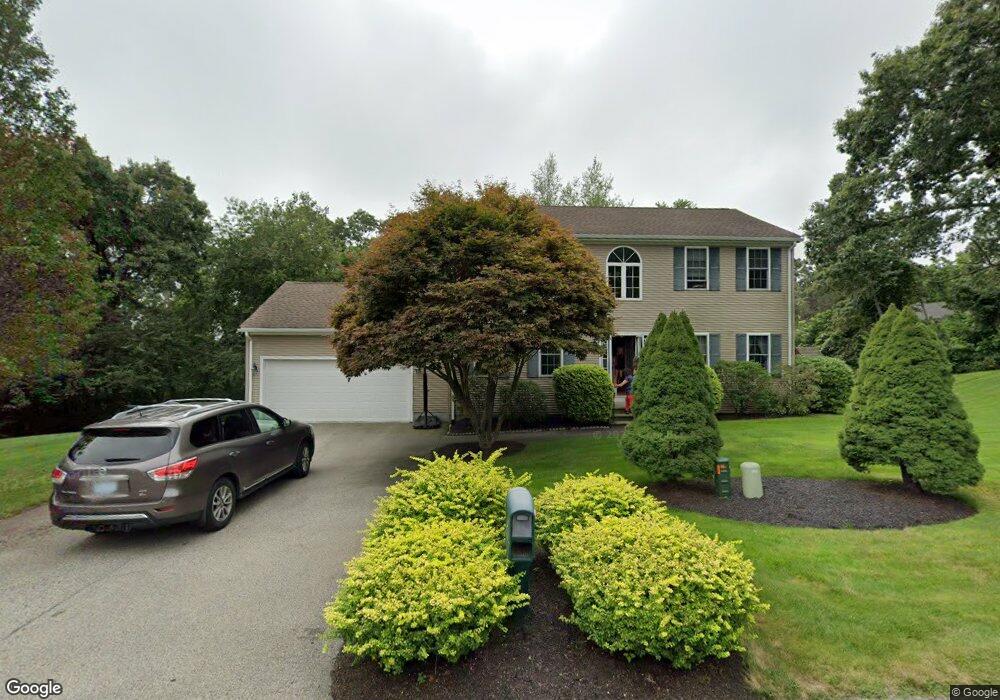
5 Briden St North Smithfield, RI 02896
Estimated Value: $552,346 - $735,000
3
Beds
3
Baths
1,768
Sq Ft
$365/Sq Ft
Est. Value
About This Home
This home is located at 5 Briden St, North Smithfield, RI 02896 and is currently estimated at $645,337, approximately $365 per square foot. 5 Briden St is a home located in Providence County with nearby schools including Woonsocket High School, Founders Academy, and Beacon Charter School.
Ownership History
Date
Name
Owned For
Owner Type
Purchase Details
Closed on
Feb 11, 2015
Sold by
Maheau Scott C
Bought by
Majeau Scott C and Maheya Lynne M
Current Estimated Value
Purchase Details
Closed on
Jun 18, 2004
Sold by
Liz Dev Grp
Bought by
Majeau Scott C and Majeau Lynne M
Home Financials for this Owner
Home Financials are based on the most recent Mortgage that was taken out on this home.
Original Mortgage
$239,920
Interest Rate
6.12%
Mortgage Type
Purchase Money Mortgage
Create a Home Valuation Report for This Property
The Home Valuation Report is an in-depth analysis detailing your home's value as well as a comparison with similar homes in the area
Home Values in the Area
Average Home Value in this Area
Purchase History
| Date | Buyer | Sale Price | Title Company |
|---|---|---|---|
| Majeau Scott C | -- | -- | |
| Majeau Scott C | $300,000 | -- |
Source: Public Records
Mortgage History
| Date | Status | Borrower | Loan Amount |
|---|---|---|---|
| Previous Owner | Majeau Scott C | $207,000 | |
| Previous Owner | Majeau Scott C | $239,920 |
Source: Public Records
Tax History Compared to Growth
Tax History
| Year | Tax Paid | Tax Assessment Tax Assessment Total Assessment is a certain percentage of the fair market value that is determined by local assessors to be the total taxable value of land and additions on the property. | Land | Improvement |
|---|---|---|---|---|
| 2024 | $5,951 | $402,900 | $80,200 | $322,700 |
| 2023 | $5,741 | $402,900 | $80,200 | $322,700 |
| 2022 | $5,604 | $402,900 | $80,200 | $322,700 |
| 2021 | $5,341 | $327,900 | $75,900 | $252,000 |
| 2020 | $5,341 | $327,900 | $75,900 | $252,000 |
| 2019 | $5,204 | $327,900 | $75,900 | $252,000 |
| 2018 | $4,557 | $264,300 | $72,400 | $191,900 |
| 2017 | $4,446 | $264,300 | $72,400 | $191,900 |
| 2016 | $4,324 | $264,300 | $72,400 | $191,900 |
| 2015 | $4,263 | $255,600 | $72,400 | $183,200 |
| 2014 | $4,095 | $255,600 | $72,400 | $183,200 |
Source: Public Records
Map
Nearby Homes