
Landlord's Agent in 2022
Kirtan Patel
Lamacchia Realty, Inc.
(978) 944-3699
3 in this area
24 Total Sales
Estimated Value: $255,852 - $280,000
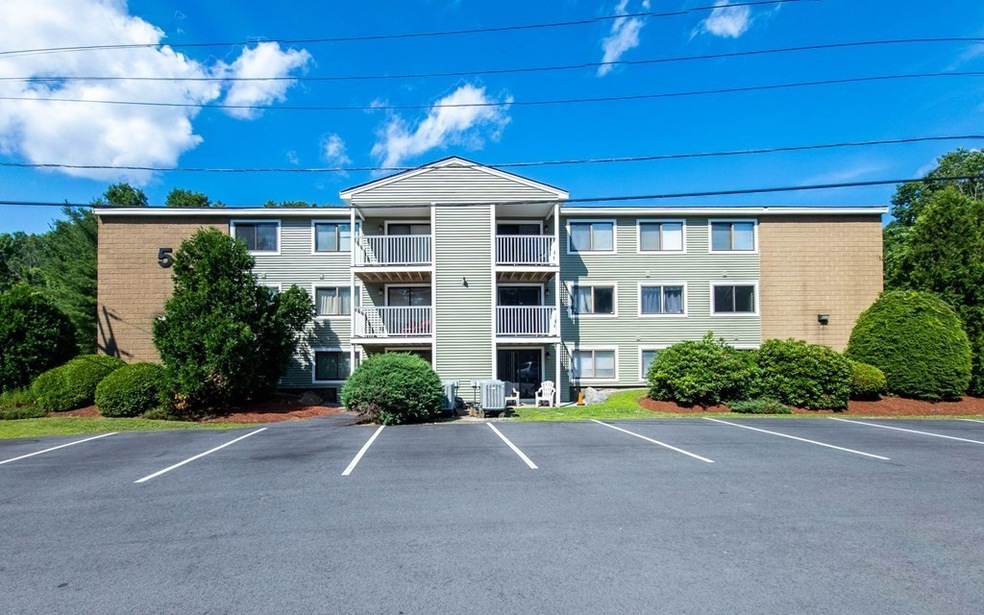
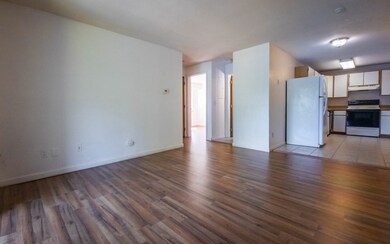
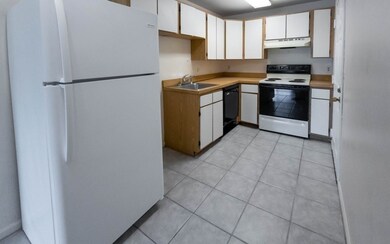
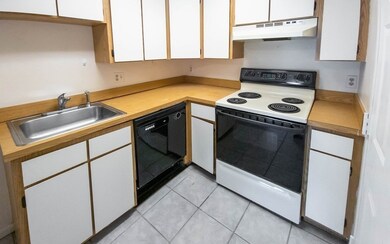
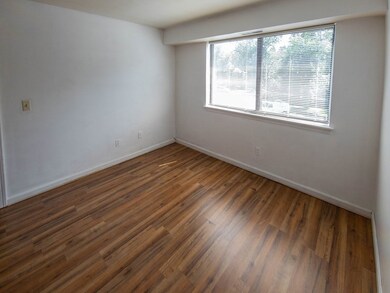
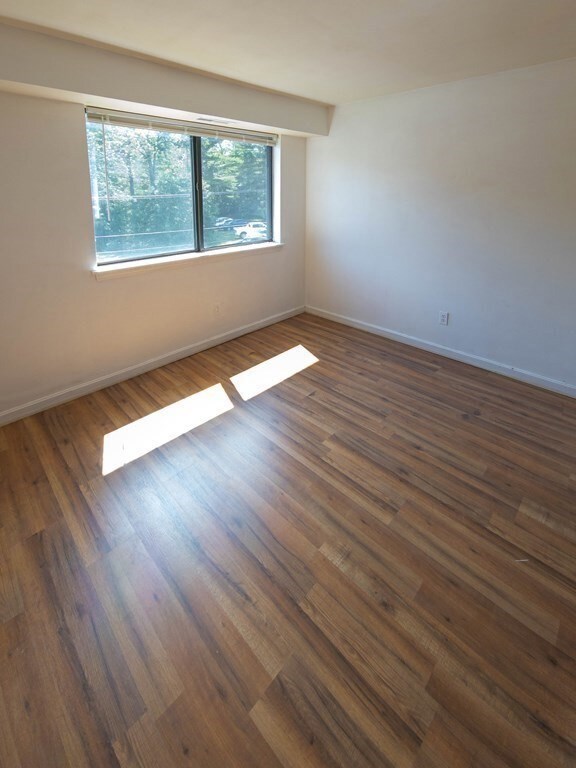
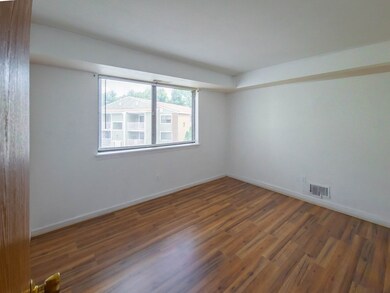
Newly renovated 2 bedroom condo with brand new hardwood floors throughout. Tons of natural light within, very spacious. This unit has an in-unit washer/dryer as well as central air-conditioning. It has a balcony patio where you can enjoy the comfort of the unit with privacy! Tenants to pay for their own utilities. Great location near Route 3 and Nashua including tax-free shopping with Pheasant Lane Mall and AMC Movie theater nearby. This unit is nice-in-ready Requires credit, references, and income information. Easy to show.
| Date | Buyer | Sale Price | Title Company |
|---|---|---|---|
| Pearce Chantha | $137,000 | -- | |
| Mackenzie Kim J | $89,900 | -- |
| Date | Status | Borrower | Loan Amount |
|---|---|---|---|
| Open | Pearce Chantha | $130,150 |
| Date | Event | Price | List to Sale | Price per Sq Ft | Prior Sale |
|---|---|---|---|---|---|
| 08/24/2022 08/24/22 | Rented | $1,800 | 0.0% | -- | |
| 07/22/2022 07/22/22 | Under Contract | -- | -- | -- | |
| 07/22/2022 07/22/22 | Price Changed | $1,800 | -10.0% | $3 / Sq Ft | |
| 07/05/2022 07/05/22 | For Rent | $2,000 | 0.0% | -- | |
| 06/29/2022 06/29/22 | Sold | $210,000 | -6.7% | $335 / Sq Ft | View Prior Sale |
| 06/01/2022 06/01/22 | Pending | -- | -- | -- | |
| 05/17/2022 05/17/22 | For Sale | $225,000 | +64.2% | $359 / Sq Ft | |
| 05/25/2018 05/25/18 | Sold | $137,000 | -2.1% | $219 / Sq Ft | View Prior Sale |
| 03/28/2018 03/28/18 | Pending | -- | -- | -- | |
| 03/23/2018 03/23/18 | For Sale | $139,900 | 0.0% | $223 / Sq Ft | |
| 02/19/2018 02/19/18 | Pending | -- | -- | -- | |
| 02/07/2018 02/07/18 | Price Changed | $139,900 | -6.7% | $223 / Sq Ft | |
| 01/09/2018 01/09/18 | For Sale | $149,900 | -- | $239 / Sq Ft |
| Year | Tax Paid | Tax Assessment Tax Assessment Total Assessment is a certain percentage of the fair market value that is determined by local assessors to be the total taxable value of land and additions on the property. | Land | Improvement |
|---|---|---|---|---|
| 2025 | $29 | $233,600 | $0 | $233,600 |
| 2024 | $2,592 | $203,800 | $0 | $203,800 |
| 2023 | $2,308 | $163,200 | $0 | $163,200 |
| 2022 | $2,138 | $143,100 | $0 | $143,100 |
| 2021 | $2,034 | $126,600 | $0 | $126,600 |
| 2020 | $1,971 | $121,300 | $0 | $121,300 |
| 2019 | $1,625 | $96,000 | $0 | $96,000 |
| 2018 | $1,519 | $88,800 | $0 | $88,800 |
| 2017 | $1,551 | $90,400 | $0 | $90,400 |
| 2016 | $1,521 | $86,600 | $0 | $86,600 |
| 2015 | $1,248 | $73,600 | $0 | $73,600 |
Landlord's Agent in 2022
Kirtan Patel
Lamacchia Realty, Inc.
(978) 944-3699
3 in this area
24 Total Sales
Seller's Agent in 2022
Sharon Narbonne
Laer Realty
(978) 996-4539
4 in this area
66 Total Sales
B
Tenant's Agent in 2022
Becky Lanteigne
Keller Williams Realty-Merrimack
3 Total Sales
Buyer's Agent in 2022
Wendi Balkan
Coldwell Banker Realty
(978) 815-9271
8 in this area
99 Total Sales
Seller's Agent in 2018
Pat Dearborn
Coldwell Banker Realty - Westford
(978) 764-5123
3 in this area
104 Total Sales
Buyer's Agent in 2018
Andy Kaknes
NextHome Tradition
(978) 437-7271
16 Total Sales
Source: MLS Property Information Network (MLS PIN)
MLS Number: 73007052
APN: TYNG-000028-000105-000024
Disclaimer: Certain information contained herein is derived from information provided by parties other than Homes.com. All information provided is deemed reliable, but is not guaranteed to be accurate and should be independently verified.
![]() The property listing data and information, or the Images, set forth herein were provided to MLS Property Information Network, Inc. from third party sources, including sellers, lessors and public records, and were compiled by MLS Property Information Network, Inc. The property listing data and information, and the Images, are for the personal, non-commercial use of consumers having a good faith interest in purchasing or leasing listed properties of the type displayed to them and may not be used for any purpose other than to identify prospective properties which such consumers may have a good faith interest in purchasing or leasing. MLS Property Information Network, Inc. and its subscribers disclaim any and all representations and warranties as to the accuracy of the property listing data and information, or as to the accuracy of any of the Images, set forth herein.
The property listing data and information, or the Images, set forth herein were provided to MLS Property Information Network, Inc. from third party sources, including sellers, lessors and public records, and were compiled by MLS Property Information Network, Inc. The property listing data and information, and the Images, are for the personal, non-commercial use of consumers having a good faith interest in purchasing or leasing listed properties of the type displayed to them and may not be used for any purpose other than to identify prospective properties which such consumers may have a good faith interest in purchasing or leasing. MLS Property Information Network, Inc. and its subscribers disclaim any and all representations and warranties as to the accuracy of the property listing data and information, or as to the accuracy of any of the Images, set forth herein.