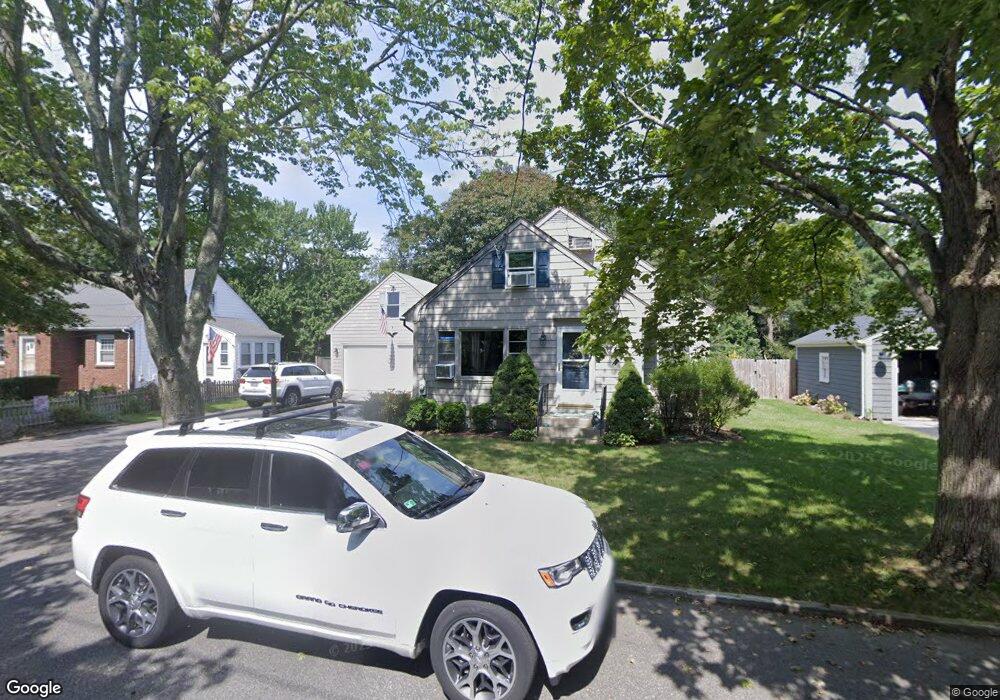
5 Brow St Barrington, RI 02806
North Barrington NeighborhoodEstimated Value: $591,000 - $709,000
3
Beds
2
Baths
1,746
Sq Ft
$366/Sq Ft
Est. Value
About This Home
This home is located at 5 Brow St, Barrington, RI 02806 and is currently estimated at $639,653, approximately $366 per square foot. 5 Brow St is a home located in Bristol County with nearby schools including Barrington High School, St Luke Elementary School, and Barrington Christian Academy.
Ownership History
Date
Name
Owned For
Owner Type
Purchase Details
Closed on
Feb 25, 2021
Sold by
Realcall Llc
Bought by
Lombardo Justin L and Lombardo Angela M
Current Estimated Value
Home Financials for this Owner
Home Financials are based on the most recent Mortgage that was taken out on this home.
Original Mortgage
$337,500
Outstanding Balance
$302,545
Interest Rate
2.7%
Mortgage Type
Purchase Money Mortgage
Estimated Equity
$337,108
Purchase Details
Closed on
Jan 13, 2020
Sold by
Dimatteo Rita
Bought by
Realcall Llc
Purchase Details
Closed on
Dec 26, 2018
Sold by
Dimatteo Anthony J Est
Bought by
Dimatteo Rita N
Purchase Details
Closed on
Aug 21, 2017
Sold by
Dimatteo Rita N
Bought by
Dimatteo Anthony J
Create a Home Valuation Report for This Property
The Home Valuation Report is an in-depth analysis detailing your home's value as well as a comparison with similar homes in the area
Home Values in the Area
Average Home Value in this Area
Purchase History
| Date | Buyer | Sale Price | Title Company |
|---|---|---|---|
| Lombardo Justin L | $375,000 | None Available | |
| Realcall Llc | $348,000 | None Available | |
| Dimatteo Rita N | -- | -- | |
| Dimatteo Anthony J | -- | -- |
Source: Public Records
Mortgage History
| Date | Status | Borrower | Loan Amount |
|---|---|---|---|
| Open | Lombardo Justin L | $337,500 |
Source: Public Records
Tax History Compared to Growth
Tax History
| Year | Tax Paid | Tax Assessment Tax Assessment Total Assessment is a certain percentage of the fair market value that is determined by local assessors to be the total taxable value of land and additions on the property. | Land | Improvement |
|---|---|---|---|---|
| 2025 | $6,918 | $451,000 | $207,000 | $244,000 |
| 2024 | $6,652 | $451,000 | $207,000 | $244,000 |
| 2023 | $6,496 | $320,000 | $118,000 | $202,000 |
| 2022 | $6,288 | $320,000 | $118,000 | $202,000 |
| 2021 | $6,128 | $320,000 | $118,000 | $202,000 |
| 2020 | $5,873 | $281,000 | $98,000 | $183,000 |
| 2019 | $5,648 | $281,000 | $98,000 | $183,000 |
| 2018 | $5,480 | $281,000 | $98,000 | $183,000 |
| 2017 | $5,418 | $270,900 | $92,500 | $178,400 |
| 2016 | $4,998 | $270,900 | $92,500 | $178,400 |
| 2015 | $4,944 | $270,900 | $92,500 | $178,400 |
| 2014 | $5,093 | $278,300 | $92,500 | $185,800 |
Source: Public Records
Map
Nearby Homes