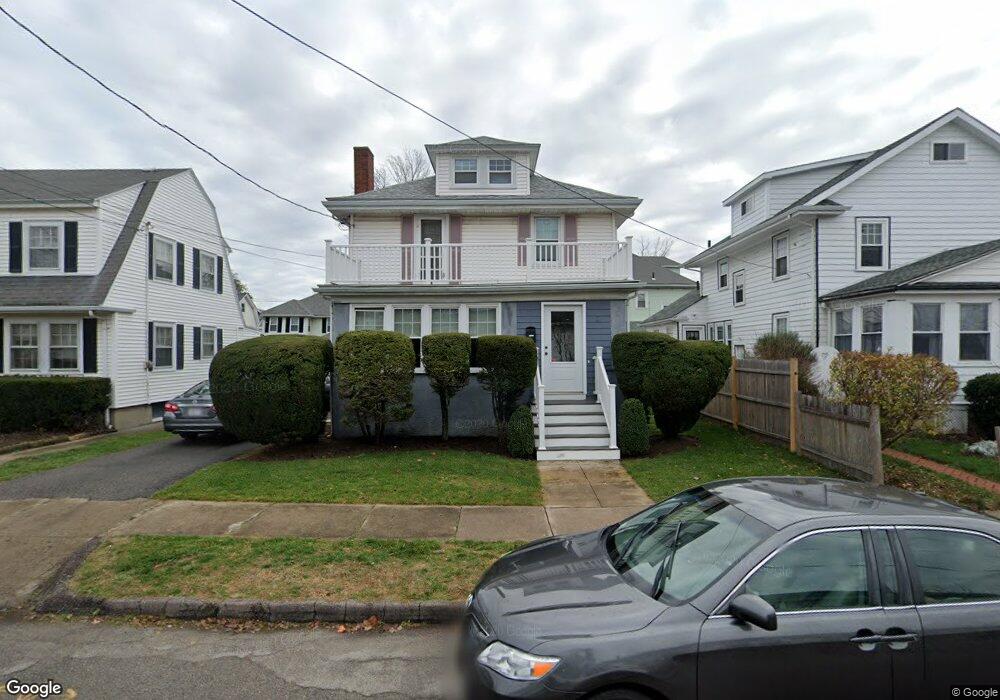
5 Buckingham Rd Quincy, MA 02170
North Quincy NeighborhoodEstimated Value: $725,572 - $783,000
4
Beds
2
Baths
1,564
Sq Ft
$482/Sq Ft
Est. Value
About This Home
This home is located at 5 Buckingham Rd, Quincy, MA 02170 and is currently estimated at $753,143, approximately $481 per square foot. 5 Buckingham Rd is a home located in Norfolk County with nearby schools including Francis W. Parker Elementary School, Atlantic Middle School, and North Quincy High School.
Ownership History
Date
Name
Owned For
Owner Type
Purchase Details
Closed on
Nov 19, 2019
Sold by
Holt Edward P and Holt Ann M
Bought by
Holt Ft
Current Estimated Value
Purchase Details
Closed on
Jan 2, 1970
Bought by
Holt Edward P and Holt Ann M
Create a Home Valuation Report for This Property
The Home Valuation Report is an in-depth analysis detailing your home's value as well as a comparison with similar homes in the area
Home Values in the Area
Average Home Value in this Area
Purchase History
| Date | Buyer | Sale Price | Title Company |
|---|---|---|---|
| Holt Ft | -- | -- | |
| Holt Edward P | -- | -- |
Source: Public Records
Mortgage History
| Date | Status | Borrower | Loan Amount |
|---|---|---|---|
| Previous Owner | Holt Edward P | $47,000 | |
| Previous Owner | Holt Edward P | $116,000 | |
| Previous Owner | Holt Edward P | $140,000 |
Source: Public Records
Tax History Compared to Growth
Tax History
| Year | Tax Paid | Tax Assessment Tax Assessment Total Assessment is a certain percentage of the fair market value that is determined by local assessors to be the total taxable value of land and additions on the property. | Land | Improvement |
|---|---|---|---|---|
| 2025 | $7,320 | $634,900 | $324,500 | $310,400 |
| 2024 | $7,085 | $628,700 | $324,500 | $304,200 |
| 2023 | $6,588 | $591,900 | $309,100 | $282,800 |
| 2022 | $6,137 | $512,300 | $247,300 | $265,000 |
| 2021 | $6,099 | $502,400 | $247,300 | $255,100 |
| 2020 | $6,020 | $484,300 | $247,300 | $237,000 |
| 2019 | $5,735 | $457,000 | $231,100 | $225,900 |
| 2018 | $5,587 | $418,800 | $210,100 | $208,700 |
| 2017 | $5,655 | $399,100 | $210,100 | $189,000 |
| 2016 | $5,276 | $367,400 | $191,000 | $176,400 |
| 2015 | $4,894 | $335,200 | $173,600 | $161,600 |
| 2014 | $4,668 | $314,100 | $165,300 | $148,800 |
Source: Public Records
Map
Nearby Homes
- 11 Earle St
- 143 Arlington St
- 250 Fayette St
- 101 Beach St
- 17 Holmes St Unit 2
- 17 Holmes St Unit 4
- 140 Phillips St
- 85 E Squantum St Unit 10
- 115 W Squantum St Unit 907
- 115 W Squantum St Unit 810
- 100 Grandview Ave Unit 11A
- 111 Warren Ave Unit 1F
- 163 Clay St Unit C
- 22 Newton Ave
- 465 Newport Ave
- 58 Bayfield Rd S
- 129-131 Pine St
- 169 Pine St
- 100 Thornton St
- 201 Billings St
- 3 Buckingham Rd
- 516 Hancock St
- 518 Hancock St
- 518 Hancock St Unit B
- 9 Buckingham Rd
- 12 Cheriton Rd
- 15 Buckingham Rd
- 2 Buckingham Rd
- 2 Cheriton Rd
- 522 Hancock St Unit B
- 2 Cheriton Rd Unit 2
- 522 Hancock St Unit 1
- 522 Hancock St
- 2 Cheriton Rd Unit 1
- 522 Hancock St Unit A
- 8 Buckingham Rd
- 14 Cheriton Rd
- 14 Buckingham Rd
- 500 Hancock St
- 517 Hancock St Unit 22