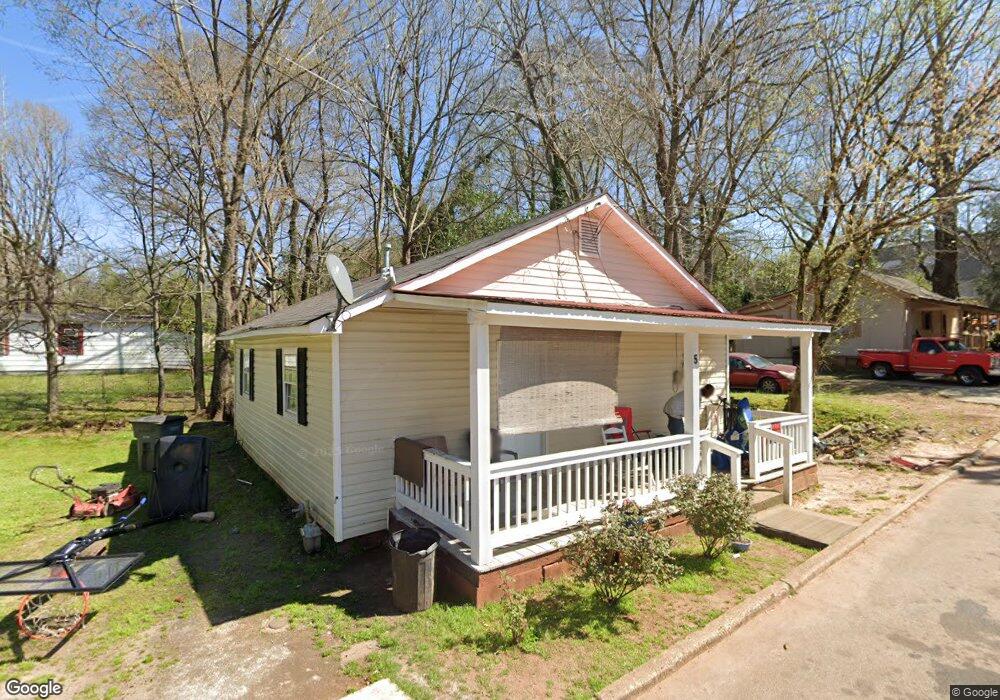
5 Burk St Lagrange, GA 30240
Estimated Value: $72,000 - $118,000
2
Beds
1
Bath
784
Sq Ft
$117/Sq Ft
Est. Value
About This Home
This home is located at 5 Burk St, Lagrange, GA 30240 and is currently estimated at $91,832, approximately $117 per square foot. 5 Burk St is a home located in Troup County with nearby schools including Franklin Forest Elementary School, Hollis Hand Elementary School, and Ethel W. Kight Elementary School.
Ownership History
Date
Name
Owned For
Owner Type
Purchase Details
Closed on
Sep 25, 2024
Sold by
Davis Edgar
Bought by
Archers 2 Llc and Archers Two Llc
Current Estimated Value
Purchase Details
Closed on
Jan 20, 1993
Sold by
Commercial Bank & Trust Co
Bought by
Perry David Bradley
Purchase Details
Closed on
Jan 5, 1993
Sold by
Sivell-Brantley Electric Inc
Bought by
Commercial Bank & Trust Co
Purchase Details
Closed on
Jun 18, 1990
Sold by
Sivell Randy and Brantley Jack E
Bought by
Sivell-Brantley Electric Inc
Purchase Details
Closed on
May 27, 1988
Sold by
Sivell Randy
Bought by
Sivell Randy and Brantley Jack E
Purchase Details
Closed on
May 21, 1983
Sold by
Bass Norman
Bought by
Sivell Randy
Purchase Details
Closed on
May 20, 1983
Sold by
Bass Kate
Bought by
Bass Norman
Purchase Details
Closed on
Jan 22, 1977
Sold by
Bass Kate
Bought by
Bass Kate
Purchase Details
Closed on
Mar 10, 1976
Sold by
Bass Kate
Bought by
Bass Kate
Purchase Details
Closed on
Sep 1, 1965
Sold by
Daniel Alton Jeff Claud,Allen
Bought by
Bass Kate
Create a Home Valuation Report for This Property
The Home Valuation Report is an in-depth analysis detailing your home's value as well as a comparison with similar homes in the area
Purchase History
| Date | Buyer | Sale Price | Title Company |
|---|---|---|---|
| Archers 2 Llc | $290,768 | -- | |
| Perry David Bradley | $25,500 | -- | |
| Commercial Bank & Trust Co | -- | -- | |
| Sivell-Brantley Electric Inc | -- | -- | |
| Sivell Randy | $1,000 | -- | |
| Sivell Randy | $6,500 | -- | |
| Bass Norman | -- | -- | |
| Bass Kate | -- | -- | |
| Bass Kate | $2,800 | -- | |
| Bass Kate | -- | -- |
Source: Public Records
Tax History
| Year | Tax Paid | Tax Assessment Tax Assessment Total Assessment is a certain percentage of the fair market value that is determined by local assessors to be the total taxable value of land and additions on the property. | Land | Improvement |
|---|---|---|---|---|
| 2025 | $633 | $23,200 | $720 | $22,480 |
| 2024 | $525 | $19,240 | $720 | $18,520 |
| 2023 | $324 | $11,880 | $720 | $11,160 |
| 2022 | $314 | $11,240 | $720 | $10,520 |
| 2021 | $222 | $7,360 | $720 | $6,640 |
| 2020 | $222 | $7,360 | $720 | $6,640 |
| 2019 | $211 | $7,000 | $720 | $6,280 |
| 2018 | $211 | $7,000 | $720 | $6,280 |
| 2017 | $147 | $7,000 | $720 | $6,280 |
| 2016 | $302 | $9,999 | $1,500 | $8,499 |
| 2015 | $279 | $9,249 | $750 | $8,499 |
| 2014 | $266 | $8,802 | $750 | $8,052 |
| 2013 | -- | $10,834 | $856 | $9,978 |
Source: Public Records
Map
Nearby Homes
- 219 Banks St
- 109 Thomas St
- 222 Beechwood Cir
- 0 Ridley Ave Unit 10550104
- 609 Ridley Ave
- 707 Ridley Ave
- 611 Ridley Ave
- 615 Ridley Ave
- 709 Ridley Ave
- 301 E Bacon St
- 900 North St
- 202 Park Hill Dr
- 110 Russell St
- 102 Dogwood Dr
- 120 Saynor Cir
- 105 Saynor Cir
- 204 Colonial St
- 600,606,608,616 S Harlem
- 206 Broad St
- 106 Ewing St
- 133 Mitchell Ave
- 133 Mitchell Ave
- 135 Mitchell Ave
- 4 Burk St
- 2 Burk St
- 131 Mitchell Ave
- 3 Burk St
- 142 Mitchell Ave
- 5 Hadaway Ct
- 1 Hadaway Ct
- 2 Hadaway Ct
- 612 N Greenwood St
- 610 N Greenwood St
- 700 N Greenwood St
- 107 Thomas St
- 101 Banks St
- 608 N Greenwood St
- 0 Greenwood St and Mitchell Ave Unit 1880164-2908677
- 103 Banks St
- 606 N Greenwood St
Your Personal Tour Guide
Ask me questions while you tour the home.