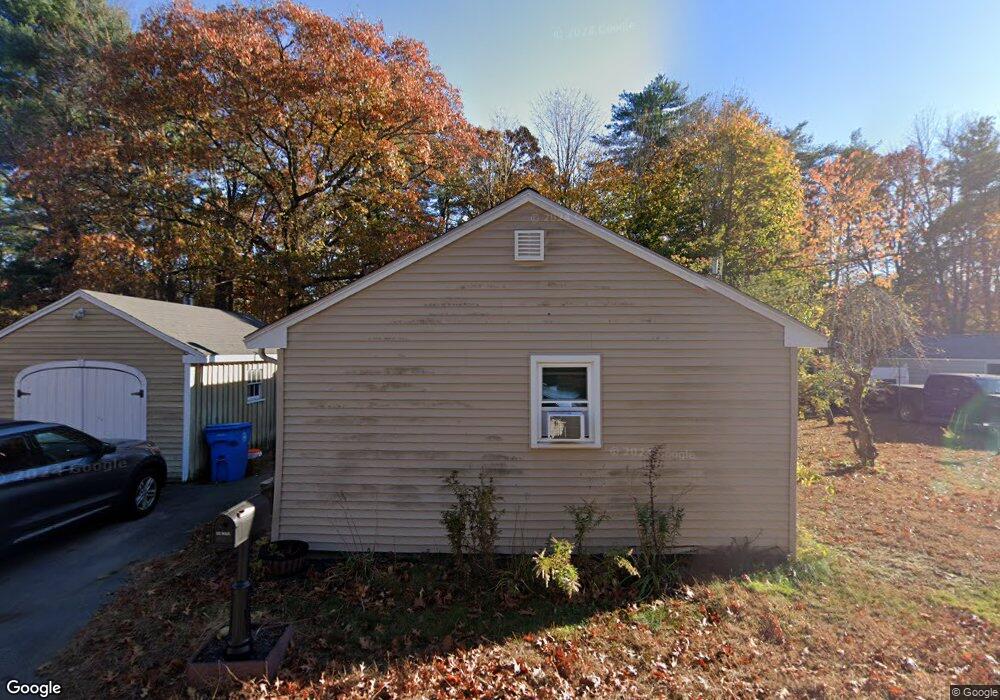
5 Burnside Ln Merrimac, MA 01860
Estimated Value: $472,000 - $563,000
3
Beds
1
Bath
904
Sq Ft
$578/Sq Ft
Est. Value
About This Home
This home is located at 5 Burnside Ln, Merrimac, MA 01860 and is currently estimated at $522,270, approximately $577 per square foot. 5 Burnside Ln is a home located in Essex County with nearby schools including Pentucket Regional High School.
Ownership History
Date
Name
Owned For
Owner Type
Purchase Details
Closed on
Jun 28, 2010
Sold by
Flewelling Timothy and Flewelling Jennifer
Bought by
Bergeron Michelle L and Dubois Scott R
Current Estimated Value
Home Financials for this Owner
Home Financials are based on the most recent Mortgage that was taken out on this home.
Original Mortgage
$219,400
Outstanding Balance
$147,677
Interest Rate
4.98%
Mortgage Type
Purchase Money Mortgage
Estimated Equity
$374,593
Purchase Details
Closed on
Apr 30, 2003
Sold by
Hughes Michelle M and Hughes Sean M
Bought by
Flewelling Timothy
Purchase Details
Closed on
Oct 31, 2001
Sold by
Willey Richard E
Bought by
Hughes Sean M and Hughes Michelle M
Purchase Details
Closed on
Dec 19, 1994
Sold by
Kelley Michael and Taddonio Mary Beth
Bought by
Willey Richard E and Willey Kimberlee A
Create a Home Valuation Report for This Property
The Home Valuation Report is an in-depth analysis detailing your home's value as well as a comparison with similar homes in the area
Home Values in the Area
Average Home Value in this Area
Purchase History
| Date | Buyer | Sale Price | Title Company |
|---|---|---|---|
| Bergeron Michelle L | $233,500 | -- | |
| Flewelling Timothy | $236,900 | -- | |
| Hughes Sean M | $215,500 | -- | |
| Willey Richard E | $126,000 | -- |
Source: Public Records
Mortgage History
| Date | Status | Borrower | Loan Amount |
|---|---|---|---|
| Open | Willey Richard E | $219,400 | |
| Closed | Willey Richard E | $8,000 |
Source: Public Records
Tax History Compared to Growth
Tax History
| Year | Tax Paid | Tax Assessment Tax Assessment Total Assessment is a certain percentage of the fair market value that is determined by local assessors to be the total taxable value of land and additions on the property. | Land | Improvement |
|---|---|---|---|---|
| 2025 | $5,666 | $427,600 | $285,300 | $142,300 |
| 2024 | $5,704 | $422,500 | $285,300 | $137,200 |
| 2023 | $5,376 | $364,000 | $247,300 | $116,700 |
| 2022 | $5,190 | $317,600 | $206,100 | $111,500 |
| 2021 | $5,126 | $314,500 | $206,100 | $108,400 |
| 2020 | $4,680 | $314,500 | $206,100 | $108,400 |
| 2019 | $3,964 | $250,700 | $152,200 | $98,500 |
| 2018 | $3,700 | $234,800 | $136,300 | $98,500 |
| 2017 | $3,735 | $228,600 | $136,300 | $92,300 |
| 2016 | $3,662 | $226,600 | $136,300 | $90,300 |
| 2015 | $3,599 | $221,500 | $136,300 | $85,200 |
| 2014 | $3,520 | $221,500 | $136,300 | $85,200 |
Source: Public Records
Map
Nearby Homes