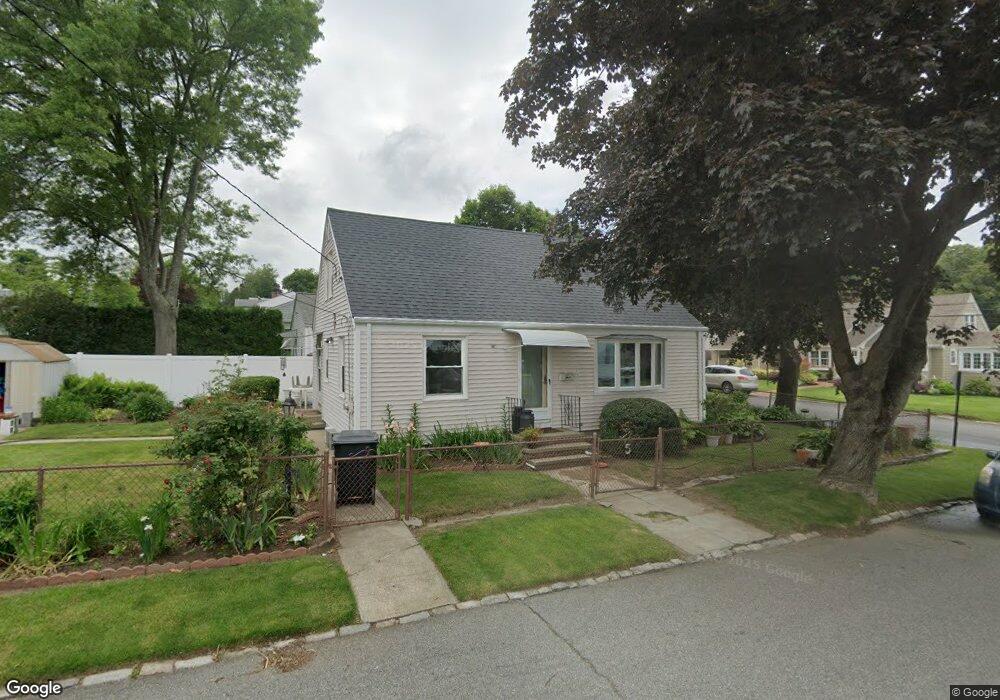
5 Burnside St North Providence, RI 02911
Fruit Hill NeighborhoodEstimated Value: $377,967 - $434,000
3
Beds
1
Bath
1,680
Sq Ft
$241/Sq Ft
Est. Value
About This Home
This home is located at 5 Burnside St, North Providence, RI 02911 and is currently estimated at $404,992, approximately $241 per square foot. 5 Burnside St is a home located in Providence County with nearby schools including North Providence High School, St. Augustine School, and St. Thomas Regional School.
Ownership History
Date
Name
Owned For
Owner Type
Purchase Details
Closed on
Jul 1, 2004
Sold by
Champagne Henry A and Champagne Nancy
Bought by
Simon Stephen R and Simon Judith
Current Estimated Value
Home Financials for this Owner
Home Financials are based on the most recent Mortgage that was taken out on this home.
Original Mortgage
$189,900
Outstanding Balance
$94,014
Interest Rate
6.3%
Mortgage Type
Purchase Money Mortgage
Estimated Equity
$310,978
Create a Home Valuation Report for This Property
The Home Valuation Report is an in-depth analysis detailing your home's value as well as a comparison with similar homes in the area
Home Values in the Area
Average Home Value in this Area
Purchase History
| Date | Buyer | Sale Price | Title Company |
|---|---|---|---|
| Simon Stephen R | $220,000 | -- |
Source: Public Records
Mortgage History
| Date | Status | Borrower | Loan Amount |
|---|---|---|---|
| Open | Simon Stephen R | $189,900 |
Source: Public Records
Tax History Compared to Growth
Tax History
| Year | Tax Paid | Tax Assessment Tax Assessment Total Assessment is a certain percentage of the fair market value that is determined by local assessors to be the total taxable value of land and additions on the property. | Land | Improvement |
|---|---|---|---|---|
| 2025 | $4,557 | $259,200 | $63,500 | $195,700 |
| 2024 | $4,305 | $259,200 | $63,500 | $195,700 |
| 2023 | $4,305 | $259,200 | $63,500 | $195,700 |
| 2022 | $4,368 | $191,500 | $53,900 | $137,600 |
| 2021 | $4,368 | $191,500 | $53,900 | $137,600 |
| 2020 | $4,368 | $191,500 | $53,900 | $137,600 |
| 2017 | $4,308 | $164,800 | $48,700 | $116,100 |
| 2016 | $3,705 | $132,600 | $42,700 | $89,900 |
| 2015 | $3,705 | $132,600 | $42,700 | $89,900 |
| 2014 | $3,705 | $132,600 | $42,700 | $89,900 |
Source: Public Records
Map
Nearby Homes
- 73 High Service Ave
- 115 Longwood Ave
- 300 Smithfield Rd Unit P2-2
- 300 Smithfield Rd Unit P3-21
- 300 Smithfield Rd Unit B5-52
- 50 Longwood Ave
- 145 Smithfield Rd Unit B
- 252 Gentian Ave
- 1285 Smith St
- 2 Longwood Ave
- 81 Gentian Ave
- 15 Lookout Ave
- 69 Cushing St
- 190 Enfield Ave
- 9 Farnum Ave
- 134 Olney Ave
- 1196 Smith St
- 79 Barrett Ave
- 80 Lubec St
- 68 Enfield Ave
- 27 Bellevue Ave
- 26 Linwood Ave
- 31 Bellevue Ave
- 28 Bellevue Ave
- 25 Bellevue Ave
- 22 Linwood Ave
- 30 Linwood Ave
- 26 Bellevue Ave
- 32 Bellevue Ave
- 18 Linwood Ave
- 22 Bellevue Ave
- 34 Bellevue Ave
- 51 Bellevue Ave
- 29 Sherman Ave
- 37 Linwood Ave
- 25 Sherman Ave
- 23 Bellevue Ave
- 20 Bellevue Ave
- 1 Redwood Dr
- 36 Linwood Ave