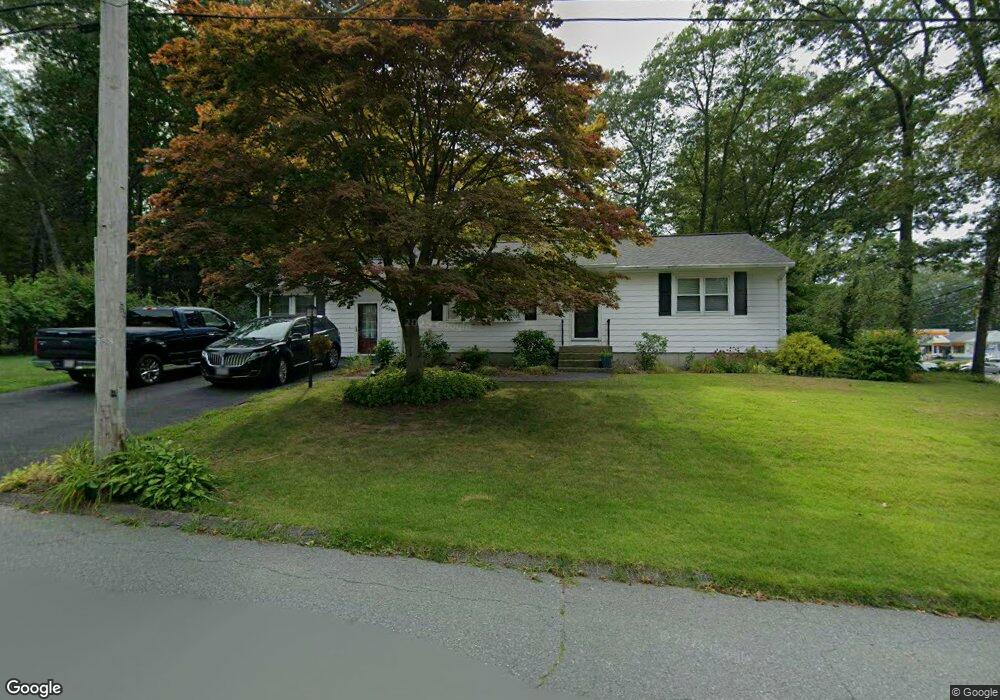
5 Burt St Attleboro, MA 02703
Estimated Value: $450,000 - $541,000
2
Beds
2
Baths
1,440
Sq Ft
$336/Sq Ft
Est. Value
About This Home
This home is located at 5 Burt St, Attleboro, MA 02703 and is currently estimated at $484,179, approximately $336 per square foot. 5 Burt St is a home located in Bristol County with nearby schools including A. Irvin Studley Elementary School, Cyril K. Brennan Middle School, and Attleboro High School.
Ownership History
Date
Name
Owned For
Owner Type
Purchase Details
Closed on
Nov 26, 2025
Sold by
Roby 2004 Ft and Roby
Bought by
Roby Irt and Roby
Current Estimated Value
Purchase Details
Closed on
Mar 4, 2004
Sold by
Roby Linda H and Roby Robert E
Bought by
Roby Two Thousand Four
Purchase Details
Closed on
Jul 11, 1988
Sold by
Soderlund Dorothy E
Bought by
Roby Robert E
Home Financials for this Owner
Home Financials are based on the most recent Mortgage that was taken out on this home.
Original Mortgage
$116,700
Interest Rate
10.54%
Mortgage Type
Purchase Money Mortgage
Create a Home Valuation Report for This Property
The Home Valuation Report is an in-depth analysis detailing your home's value as well as a comparison with similar homes in the area
Home Values in the Area
Average Home Value in this Area
Purchase History
| Date | Buyer | Sale Price | Title Company |
|---|---|---|---|
| Roby Irt | -- | -- | |
| Roby Two Thousand Four | -- | -- | |
| Roby Robert E | $129,700 | -- |
Source: Public Records
Mortgage History
| Date | Status | Borrower | Loan Amount |
|---|---|---|---|
| Previous Owner | Roby Robert E | $105,700 | |
| Previous Owner | Roby Robert E | $116,700 |
Source: Public Records
Tax History
| Year | Tax Paid | Tax Assessment Tax Assessment Total Assessment is a certain percentage of the fair market value that is determined by local assessors to be the total taxable value of land and additions on the property. | Land | Improvement |
|---|---|---|---|---|
| 2025 | $4,502 | $358,700 | $137,800 | $220,900 |
| 2024 | $4,364 | $342,800 | $137,800 | $205,000 |
| 2023 | $4,137 | $302,200 | $125,100 | $177,100 |
| 2022 | $3,982 | $275,600 | $119,300 | $156,300 |
| 2021 | $4,432 | $249,500 | $114,700 | $134,800 |
| 2020 | $4,545 | $246,400 | $111,500 | $134,900 |
| 2019 | $3,428 | $242,100 | $109,300 | $132,800 |
| 2018 | $4,741 | $226,800 | $106,200 | $120,600 |
| 2017 | $3,130 | $215,100 | $106,200 | $108,900 |
| 2016 | $2,982 | $201,200 | $104,200 | $97,000 |
| 2015 | $2,980 | $202,600 | $104,200 | $98,400 |
| 2014 | $2,780 | $187,200 | $99,100 | $88,100 |
Source: Public Records
Map
Nearby Homes
- 720 Thacher St
- 660 Thacher St Unit 402
- 101 South Ave Unit 1004
- 101 South Ave Unit 501
- 23 Greenhill Ave
- 855 County St Unit 2
- 457 Tiffany St
- 17 Jewel Ave
- 160 West St
- 126 Linden St Unit A
- 0 Joseph St Unit 73469304
- 0 Tulip Unit 73482326
- 0 Tulip Unit 73482330
- 124 Tiffany St
- 142 Fisher St Unit B
- 142 Fisher St Unit A
- 138 Fisher St Unit A
- 1 Bellmore St
- 49 Dennis St
- 46 Berwick Rd
Your Personal Tour Guide
Ask me questions while you tour the home.