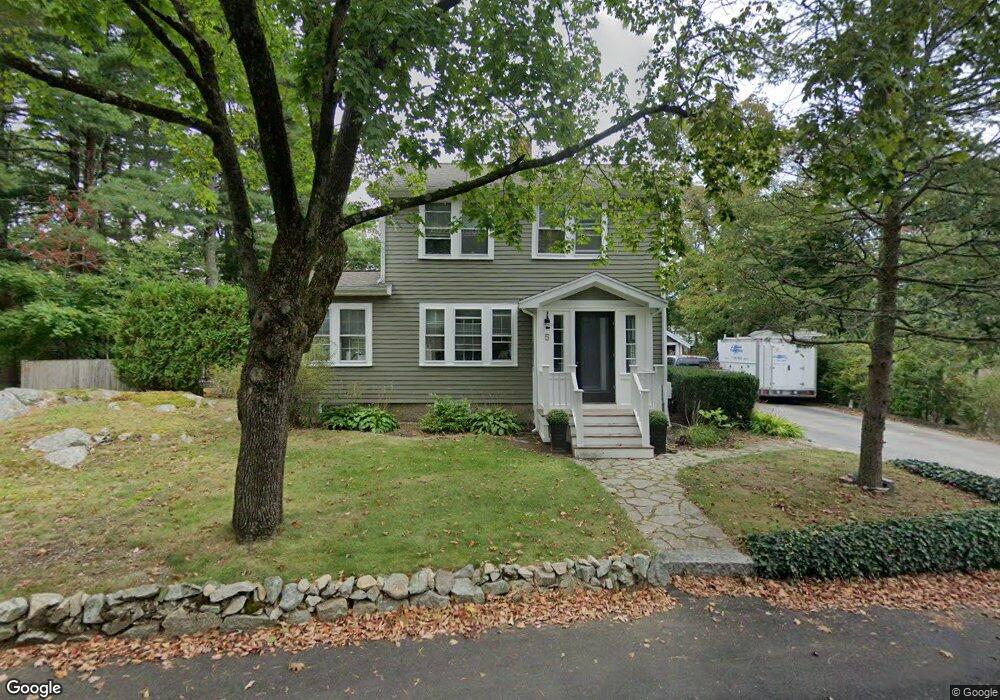
5 Butler Rd Hingham, MA 02043
Estimated Value: $952,000 - $1,594,000
4
Beds
3
Baths
2,127
Sq Ft
$566/Sq Ft
Est. Value
About This Home
This home is located at 5 Butler Rd, Hingham, MA 02043 and is currently estimated at $1,203,034, approximately $565 per square foot. 5 Butler Rd is a home located in Plymouth County with nearby schools including Plymouth River Elementary School, Hingham Middle School, and Hingham High School.
Ownership History
Date
Name
Owned For
Owner Type
Purchase Details
Closed on
Jan 25, 1993
Sold by
Lussier Edward F and Lussier Allyson B
Bought by
Todd Lisa C and Corvelli Edmund
Current Estimated Value
Home Financials for this Owner
Home Financials are based on the most recent Mortgage that was taken out on this home.
Original Mortgage
$125,000
Interest Rate
8.15%
Mortgage Type
Purchase Money Mortgage
Purchase Details
Closed on
Mar 24, 1987
Sold by
Collins Michael J
Bought by
Lussier Edward F
Create a Home Valuation Report for This Property
The Home Valuation Report is an in-depth analysis detailing your home's value as well as a comparison with similar homes in the area
Purchase History
| Date | Buyer | Sale Price | Title Company |
|---|---|---|---|
| Todd Lisa C | $240,000 | -- | |
| Lussier Edward F | $195,000 | -- |
Source: Public Records
Mortgage History
| Date | Status | Borrower | Loan Amount |
|---|---|---|---|
| Open | Lussier Edward F | $100,000 | |
| Closed | Lussier Edward F | $125,000 | |
| Previous Owner | Lussier Edward F | $144,000 | |
| Previous Owner | Lussier Edward F | $15,000 |
Source: Public Records
Tax History
| Year | Tax Paid | Tax Assessment Tax Assessment Total Assessment is a certain percentage of the fair market value that is determined by local assessors to be the total taxable value of land and additions on the property. | Land | Improvement |
|---|---|---|---|---|
| 2025 | $9,663 | $903,900 | $567,500 | $336,400 |
| 2024 | $9,493 | $874,900 | $567,500 | $307,400 |
| 2023 | $8,475 | $847,500 | $567,500 | $280,000 |
| 2022 | $8,030 | $694,600 | $472,900 | $221,700 |
| 2021 | $8,201 | $695,000 | $492,600 | $202,400 |
| 2020 | $8,013 | $695,000 | $492,600 | $202,400 |
| 2019 | $0 | $682,200 | $492,600 | $189,600 |
| 2018 | $0 | $630,000 | $394,100 | $235,900 |
| 2017 | $0 | $554,800 | $389,300 | $165,500 |
| 2016 | $6,698 | $536,300 | $370,800 | $165,500 |
| 2015 | $6,781 | $541,200 | $353,300 | $187,900 |
Source: Public Records
Map
Nearby Homes
Your Personal Tour Guide
Ask me questions while you tour the home.