5 Carter Farm Rd Saco, ME 04072
North Saco NeighborhoodEstimated Value: $542,000 - $686,000
2
Beds
2
Baths
1,979
Sq Ft
$322/Sq Ft
Est. Value
About This Home
This home is located at 5 Carter Farm Rd, Saco, ME 04072 and is currently estimated at $637,734, approximately $322 per square foot. 5 Carter Farm Rd is a home located in York County with nearby schools including C K Burns School and Saco Middle School.
Ownership History
Date
Name
Owned For
Owner Type
Purchase Details
Closed on
Nov 22, 2024
Sold by
Stetson Debra
Bought by
Stetson Brian J and Stetson Debra
Current Estimated Value
Purchase Details
Closed on
Dec 11, 2021
Sold by
Stetson Lloyd and Stetson Debra
Bought by
Stetson Lloyd and Stetson Debra
Create a Home Valuation Report for This Property
The Home Valuation Report is an in-depth analysis detailing your home's value as well as a comparison with similar homes in the area
Home Values in the Area
Average Home Value in this Area
Purchase History
| Date | Buyer | Sale Price | Title Company |
|---|---|---|---|
| Stetson Brian J | -- | None Available | |
| Stetson Brian J | -- | None Available | |
| Boissonneault Jill A | -- | None Available | |
| Stetson Debra | -- | None Available | |
| Stetson Lloyd | -- | None Available | |
| Stetson Lloyd | -- | None Available | |
| Stetson Lloyd | -- | None Available |
Source: Public Records
Tax History Compared to Growth
Tax History
| Year | Tax Paid | Tax Assessment Tax Assessment Total Assessment is a certain percentage of the fair market value that is determined by local assessors to be the total taxable value of land and additions on the property. | Land | Improvement |
|---|---|---|---|---|
| 2024 | $7,754 | $551,900 | $152,900 | $399,000 |
| 2023 | $8,141 | $551,900 | $152,900 | $399,000 |
| 2022 | $7,277 | $397,000 | $116,500 | $280,500 |
| 2021 | $6,912 | $366,100 | $105,200 | $260,900 |
| 2020 | $6,499 | $330,400 | $92,500 | $237,900 |
| 2019 | $6,403 | $330,400 | $92,500 | $237,900 |
| 2018 | $6,240 | $322,000 | $84,100 | $237,900 |
| 2017 | $5,769 | $297,700 | $77,100 | $220,600 |
| 2016 | $5,379 | $277,000 | $62,100 | $214,900 |
| 2015 | $5,247 | $273,000 | $60,800 | $212,200 |
| 2014 | $5,083 | $273,000 | $60,800 | $212,200 |
| 2013 | $5,072 | $273,000 | $60,800 | $212,200 |
Source: Public Records
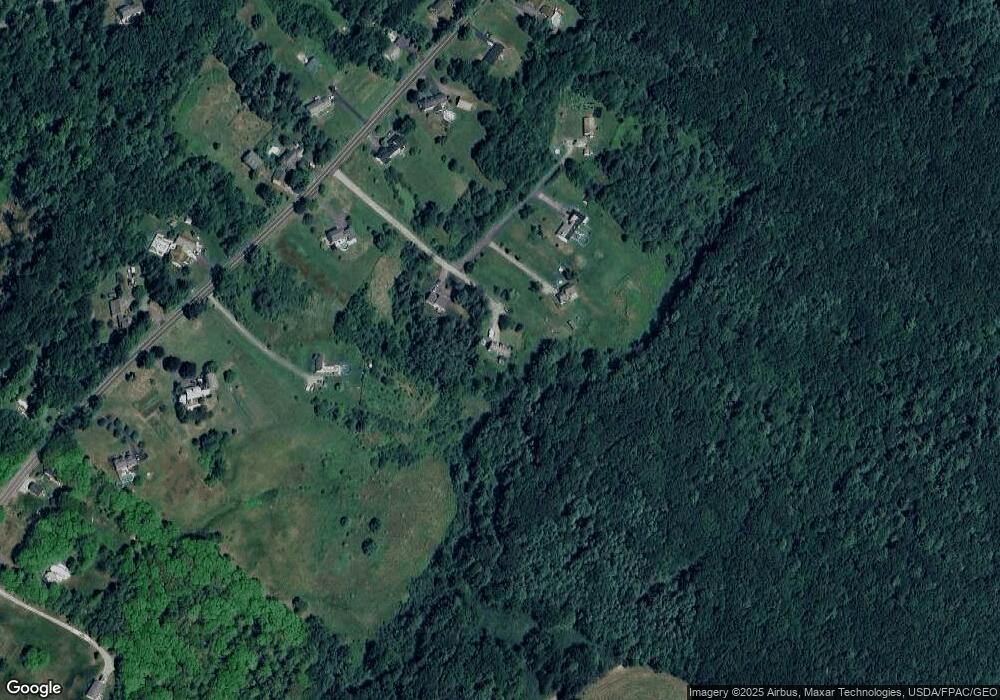
Map
Nearby Homes
- 75 Ash Swamp Rd
- 159 Stewart Dr
- 90 Broadturn Rd Unit 9
- 155 Stewart Dr
- 153 Stewart Dr
- 149 Stewart Dr
- 96C Broadturn Rd
- 91 B Broadturn Rd
- 29 Mccann Way Unit 29
- 72 Stewart Dr
- 994 Portland Rd Unit 14
- 994 Portland Rd Unit 4
- 9 Paulsen Dr
- 19 Paulsen Dr
- 5 Marguerite Rd
- 79 Creeks Edge Dr
- 77 Creeks Edge Dr
- 31 Old Blue Point Rd
- 626 Us Route 1
- 81 Creeks Edge Dr