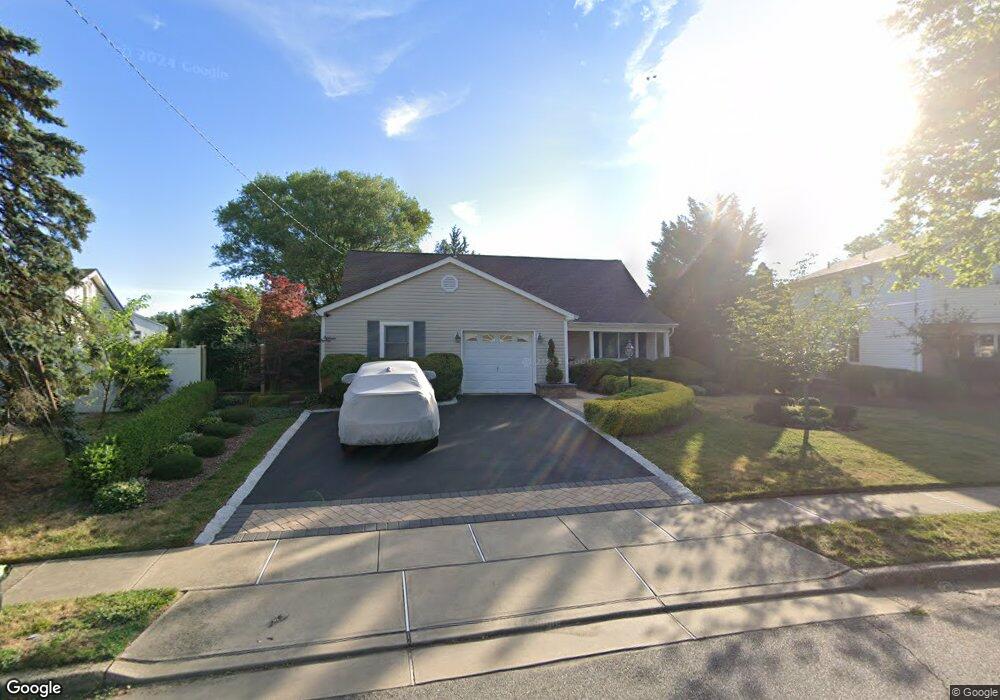
5 Cavan Ln Hazlet, NJ 07730
Estimated Value: $673,000 - $699,000
3
Beds
3
Baths
2,158
Sq Ft
$319/Sq Ft
Est. Value
About This Home
This home is located at 5 Cavan Ln, Hazlet, NJ 07730 and is currently estimated at $689,226, approximately $319 per square foot. 5 Cavan Ln is a home located in Monmouth County with nearby schools including Raritan High School, St Benedict School, and St. Joseph Elementary School.
Ownership History
Date
Name
Owned For
Owner Type
Purchase Details
Closed on
Jan 5, 2004
Sold by
Pelusio Annette
Bought by
Pirozzi Paul and Pirozzi Mary
Current Estimated Value
Home Financials for this Owner
Home Financials are based on the most recent Mortgage that was taken out on this home.
Original Mortgage
$155,000
Interest Rate
5.83%
Purchase Details
Closed on
Aug 21, 2002
Sold by
Botwin Ira
Bought by
Pelusio Michael and Pelusio Annette
Home Financials for this Owner
Home Financials are based on the most recent Mortgage that was taken out on this home.
Original Mortgage
$213,000
Interest Rate
6.25%
Create a Home Valuation Report for This Property
The Home Valuation Report is an in-depth analysis detailing your home's value as well as a comparison with similar homes in the area
Home Values in the Area
Average Home Value in this Area
Purchase History
| Date | Buyer | Sale Price | Title Company |
|---|---|---|---|
| Pirozzi Paul | $310,000 | -- | |
| Pelusio Michael | $253,000 | -- |
Source: Public Records
Mortgage History
| Date | Status | Borrower | Loan Amount |
|---|---|---|---|
| Previous Owner | Pirozzi Paul | $155,000 | |
| Previous Owner | Pelusio Michael | $213,000 |
Source: Public Records
Tax History Compared to Growth
Tax History
| Year | Tax Paid | Tax Assessment Tax Assessment Total Assessment is a certain percentage of the fair market value that is determined by local assessors to be the total taxable value of land and additions on the property. | Land | Improvement |
|---|---|---|---|---|
| 2025 | $11,676 | $618,300 | $377,000 | $241,300 |
| 2024 | $11,328 | $555,200 | $315,000 | $240,200 |
| 2023 | $11,328 | $530,100 | $292,000 | $238,100 |
| 2022 | $9,501 | $436,700 | $227,000 | $209,700 |
| 2021 | $9,501 | $405,500 | $219,000 | $186,500 |
| 2020 | $10,207 | $395,300 | $213,000 | $182,300 |
| 2019 | $9,920 | $378,200 | $197,000 | $181,200 |
| 2018 | $9,702 | $366,800 | $194,000 | $172,800 |
| 2017 | $9,429 | $356,500 | $189,000 | $167,500 |
| 2016 | $9,283 | $352,300 | $189,000 | $163,300 |
| 2015 | $8,830 | $345,500 | $188,000 | $157,500 |
| 2014 | $8,498 | $312,200 | $162,000 | $150,200 |
Source: Public Records
Map
Nearby Homes