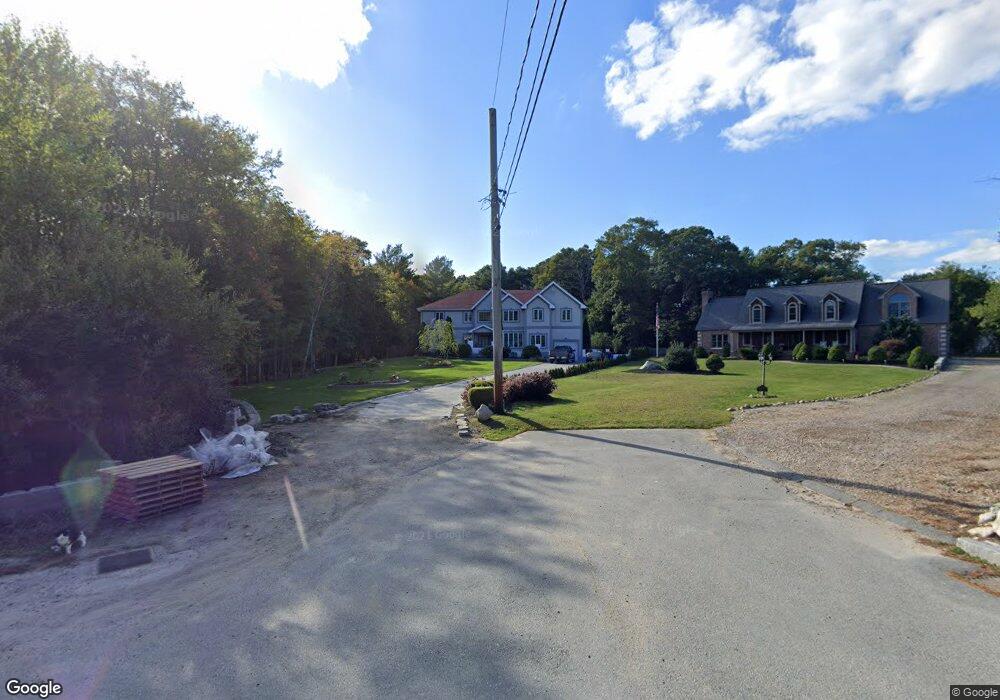
5 Cedar Ln Westport, MA 02790
North Westport NeighborhoodEstimated Value: $875,000 - $954,836
2
Beds
--
Bath
4,215
Sq Ft
$214/Sq Ft
Est. Value
About This Home
This home is located at 5 Cedar Ln, Westport, MA 02790 and is currently estimated at $902,209, approximately $214 per square foot. 5 Cedar Ln is a home located in Bristol County with nearby schools including Alice A. Macomber Primary School, Westport Elementary School, and Westport Middle-High School.
Ownership History
Date
Name
Owned For
Owner Type
Purchase Details
Closed on
Jul 15, 2025
Sold by
Senra Fatima
Bought by
Senra Fatima and Senra Maria C
Current Estimated Value
Purchase Details
Closed on
Dec 15, 2000
Sold by
Borden Thomas E and Borden Timothy E
Bought by
Senra Joao
Create a Home Valuation Report for This Property
The Home Valuation Report is an in-depth analysis detailing your home's value as well as a comparison with similar homes in the area
Home Values in the Area
Average Home Value in this Area
Purchase History
| Date | Buyer | Sale Price | Title Company |
|---|---|---|---|
| Senra Fatima | -- | -- | |
| Senra Fatima | -- | -- | |
| Senra Fatima | -- | -- | |
| Senra Fatima | -- | -- | |
| Senra Fatima | -- | -- | |
| Senra Fatima | -- | -- | |
| Senra Joao | $75,000 | -- | |
| Senra Joao | $75,000 | -- |
Source: Public Records
Mortgage History
| Date | Status | Borrower | Loan Amount |
|---|---|---|---|
| Previous Owner | Senra Joao | $250,000 | |
| Previous Owner | Senra Joao | $50,000 |
Source: Public Records
Tax History Compared to Growth
Tax History
| Year | Tax Paid | Tax Assessment Tax Assessment Total Assessment is a certain percentage of the fair market value that is determined by local assessors to be the total taxable value of land and additions on the property. | Land | Improvement |
|---|---|---|---|---|
| 2025 | $6,305 | $846,300 | $221,200 | $625,100 |
| 2024 | $5,968 | $772,100 | $198,800 | $573,300 |
| 2023 | $5,908 | $724,000 | $182,600 | $541,400 |
| 2022 | $5,613 | $661,900 | $182,600 | $479,300 |
| 2021 | $5,455 | $632,800 | $153,500 | $479,300 |
| 2020 | $5,292 | $627,800 | $148,500 | $479,300 |
| 2019 | $5,371 | $649,400 | $148,500 | $500,900 |
| 2018 | $5,031 | $615,800 | $146,900 | $468,900 |
| 2017 | $5,035 | $631,700 | $143,200 | $488,500 |
| 2016 | $5,024 | $635,100 | $139,400 | $495,700 |
| 2015 | $4,603 | $580,400 | $141,900 | $438,500 |
Source: Public Records
Map
Nearby Homes