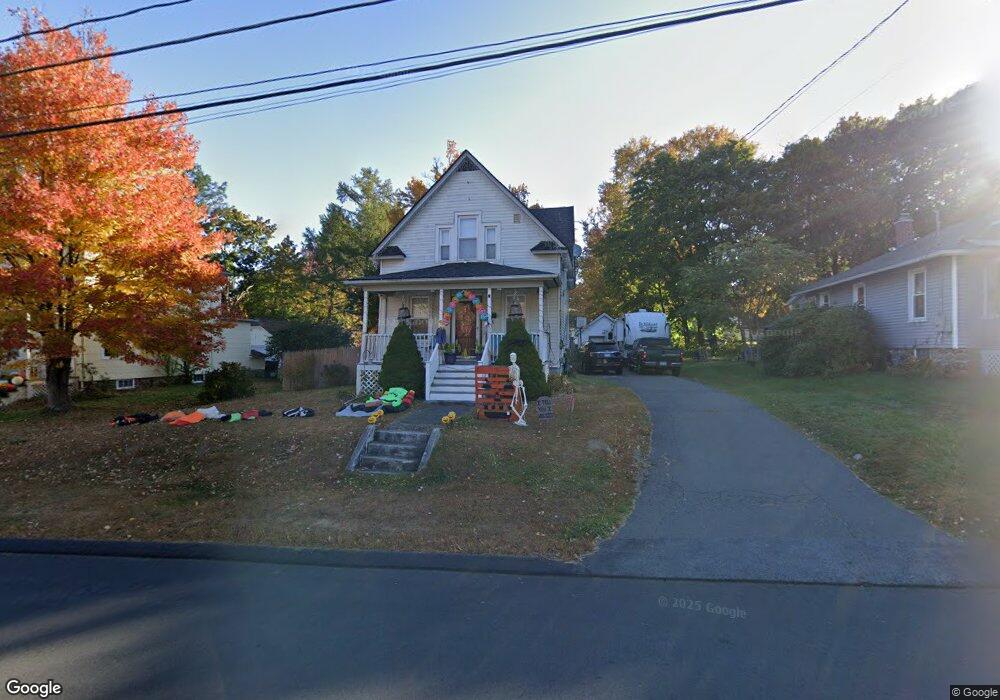
5 Cedar St Terryville, CT 06786
Estimated Value: $256,000 - $277,000
3
Beds
1
Bath
1,050
Sq Ft
$255/Sq Ft
Est. Value
About This Home
This home is located at 5 Cedar St, Terryville, CT 06786 and is currently estimated at $267,817, approximately $255 per square foot. 5 Cedar St is a home located in Litchfield County with nearby schools including Plymouth Center School, Eli Terry Jr. Middle School, and Terryville High School.
Ownership History
Date
Name
Owned For
Owner Type
Purchase Details
Closed on
Nov 15, 2021
Sold by
Fortin Kimberly A
Bought by
Fortin Kimberly A and Fortin Jared
Current Estimated Value
Home Financials for this Owner
Home Financials are based on the most recent Mortgage that was taken out on this home.
Original Mortgage
$127,187
Outstanding Balance
$99,989
Interest Rate
3.05%
Mortgage Type
FHA
Estimated Equity
$167,828
Purchase Details
Closed on
Nov 7, 2007
Sold by
Daveluy Holly M
Bought by
Fortin Kimberly A
Home Financials for this Owner
Home Financials are based on the most recent Mortgage that was taken out on this home.
Original Mortgage
$152,000
Interest Rate
6.47%
Purchase Details
Closed on
Jun 22, 2000
Sold by
Rohe Irene
Bought by
Daveluy Kenneth A
Home Financials for this Owner
Home Financials are based on the most recent Mortgage that was taken out on this home.
Original Mortgage
$65,000
Interest Rate
8.48%
Create a Home Valuation Report for This Property
The Home Valuation Report is an in-depth analysis detailing your home's value as well as a comparison with similar homes in the area
Home Values in the Area
Average Home Value in this Area
Purchase History
| Date | Buyer | Sale Price | Title Company |
|---|---|---|---|
| Fortin Kimberly A | -- | None Available | |
| Fortin Kimberly A | -- | None Available | |
| Fortin Kimberly A | -- | None Available | |
| Fortin Kimberly A | $160,000 | -- | |
| Daveluy Kenneth A | $45,000 | -- | |
| Fortin Kimberly A | $160,000 | -- | |
| Daveluy Kenneth A | $45,000 | -- |
Source: Public Records
Mortgage History
| Date | Status | Borrower | Loan Amount |
|---|---|---|---|
| Open | Fortin Kimberly A | $127,187 | |
| Closed | Fortin Kimberly A | $127,187 | |
| Previous Owner | Daveluy Kenneth A | $152,000 | |
| Previous Owner | Daveluy Kenneth A | $80,000 | |
| Previous Owner | Daveluy Kenneth A | $65,000 |
Source: Public Records
Tax History Compared to Growth
Tax History
| Year | Tax Paid | Tax Assessment Tax Assessment Total Assessment is a certain percentage of the fair market value that is determined by local assessors to be the total taxable value of land and additions on the property. | Land | Improvement |
|---|---|---|---|---|
| 2025 | $3,731 | $94,290 | $42,350 | $51,940 |
| 2024 | $3,643 | $94,290 | $42,350 | $51,940 |
| 2023 | $3,555 | $94,290 | $42,350 | $51,940 |
| 2022 | $3,425 | $94,290 | $42,350 | $51,940 |
| 2021 | $3,467 | $85,337 | $41,790 | $43,547 |
| 2020 | $3,467 | $85,337 | $41,790 | $43,547 |
| 2019 | $3,467 | $85,337 | $41,790 | $43,547 |
| 2016 | $3,149 | $87,416 | $41,790 | $45,626 |
| 2015 | $3,097 | $87,416 | $41,790 | $45,626 |
| 2014 | $3,046 | $87,416 | $41,790 | $45,626 |
Source: Public Records
Map
Nearby Homes