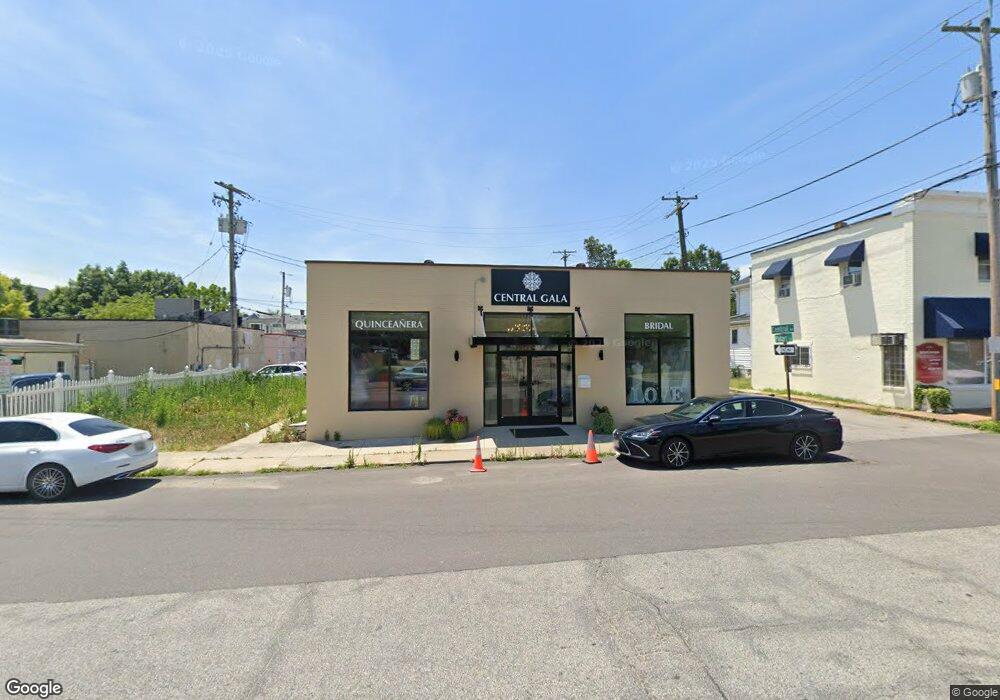
5 Central Ave Glen Burnie, MD 21061
Estimated Value: $571,763
--
Bed
--
Bath
3,696
Sq Ft
$155/Sq Ft
Est. Value
About This Home
This home is located at 5 Central Ave, Glen Burnie, MD 21061 and is currently estimated at $571,763, approximately $154 per square foot. 5 Central Ave is a home located in Anne Arundel County with nearby schools including Richard Henry Lee Elementary School, Corkran Middle School, and Glen Burnie High School.
Ownership History
Date
Name
Owned For
Owner Type
Purchase Details
Closed on
Oct 31, 2023
Sold by
Waxman Seth B
Bought by
Terra Nova Properties P Llc
Current Estimated Value
Home Financials for this Owner
Home Financials are based on the most recent Mortgage that was taken out on this home.
Original Mortgage
$400,000
Outstanding Balance
$393,400
Interest Rate
7.79%
Mortgage Type
FHA
Estimated Equity
$178,363
Purchase Details
Closed on
Aug 21, 2002
Sold by
Freeland Ronald W
Bought by
Md Congress Of Parents and Teachers Inc
Purchase Details
Closed on
Feb 27, 1992
Sold by
Glen Burnie Urban Renewal Assocs
Bought by
Freeland Ronald W
Home Financials for this Owner
Home Financials are based on the most recent Mortgage that was taken out on this home.
Original Mortgage
$216,125
Interest Rate
8.82%
Create a Home Valuation Report for This Property
The Home Valuation Report is an in-depth analysis detailing your home's value as well as a comparison with similar homes in the area
Home Values in the Area
Average Home Value in this Area
Purchase History
| Date | Buyer | Sale Price | Title Company |
|---|---|---|---|
| Terra Nova Properties P Llc | $520,000 | Title-Rite | |
| Terra Nova Properties P Llc | $520,000 | Title-Rite | |
| Md Congress Of Parents | $270,000 | -- | |
| Freeland Ronald W | $175,000 | -- |
Source: Public Records
Mortgage History
| Date | Status | Borrower | Loan Amount |
|---|---|---|---|
| Open | Terra Nova Properties P Llc | $400,000 | |
| Closed | Terra Nova Properties P Llc | $400,000 | |
| Previous Owner | Freeland Ronald W | $216,125 |
Source: Public Records
Tax History Compared to Growth
Tax History
| Year | Tax Paid | Tax Assessment Tax Assessment Total Assessment is a certain percentage of the fair market value that is determined by local assessors to be the total taxable value of land and additions on the property. | Land | Improvement |
|---|---|---|---|---|
| 2025 | $4,234 | $386,200 | $198,400 | $187,800 |
| 2024 | $4,234 | $379,133 | $0 | $0 |
| 2023 | $3,930 | $372,067 | $0 | $0 |
| 2022 | $74 | $365,000 | $198,400 | $166,600 |
| 2021 | $79 | $359,167 | $0 | $0 |
| 2020 | $79 | $353,333 | $0 | $0 |
| 2019 | $75 | $347,500 | $194,800 | $152,700 |
| 2018 | $71 | $336,067 | $0 | $0 |
| 2017 | $71 | $324,633 | $0 | $0 |
| 2016 | -- | $313,200 | $0 | $0 |
| 2015 | -- | $297,233 | $0 | $0 |
| 2014 | -- | $281,267 | $0 | $0 |
Source: Public Records
Map
Nearby Homes
- 108 1st Ave SW
- 100 3rd Ave SE
- 106 3rd Ave SE
- 105 Chestnut Ln
- 105 New Jersey Ave NW
- 108 New Jersey Ave NW
- 102 Kent Rd
- 330 New Jersey Ave NE
- 305 Newfield Rd
- 301 Newfield Rd
- 102 Kuethe Rd NE
- 611 Glenview Ave
- 101 Kuethe Rd NE
- 209 Lincoln Ave SW
- 102 Garrett Rd
- 420 Lincoln Ave SW
- 19 Main Ave SW
- 133 Glen Rd
- 118 Heather Stone Way Unit 80
- 625 Newfield Rd
- 7 Central Ave
- 4 Crain Hwy S
- 302 Crain Hwy S Unit 2
- 302 Crain Hwy S Unit 103
- 2 Crain Hwy S Unit A
- 2 Crain Hwy S
- 2 Crain Hwy S Unit 2A
- 4 Platzers Ln
- 9 Central Ave
- 8 Platzer Ln SW
- 12 14 Crain Hwy SW
- 10 Crain Hwy S
- 2 Crain Hwy N Unit 2B
- 8 Crain Hwy N
- 20 Crain Hwy S
- 16 Crain Hwy S
- 20 Crain Hwy N
- 15 Central Ave
- 6 1st Ave SW
- 1 Crain Hwy S